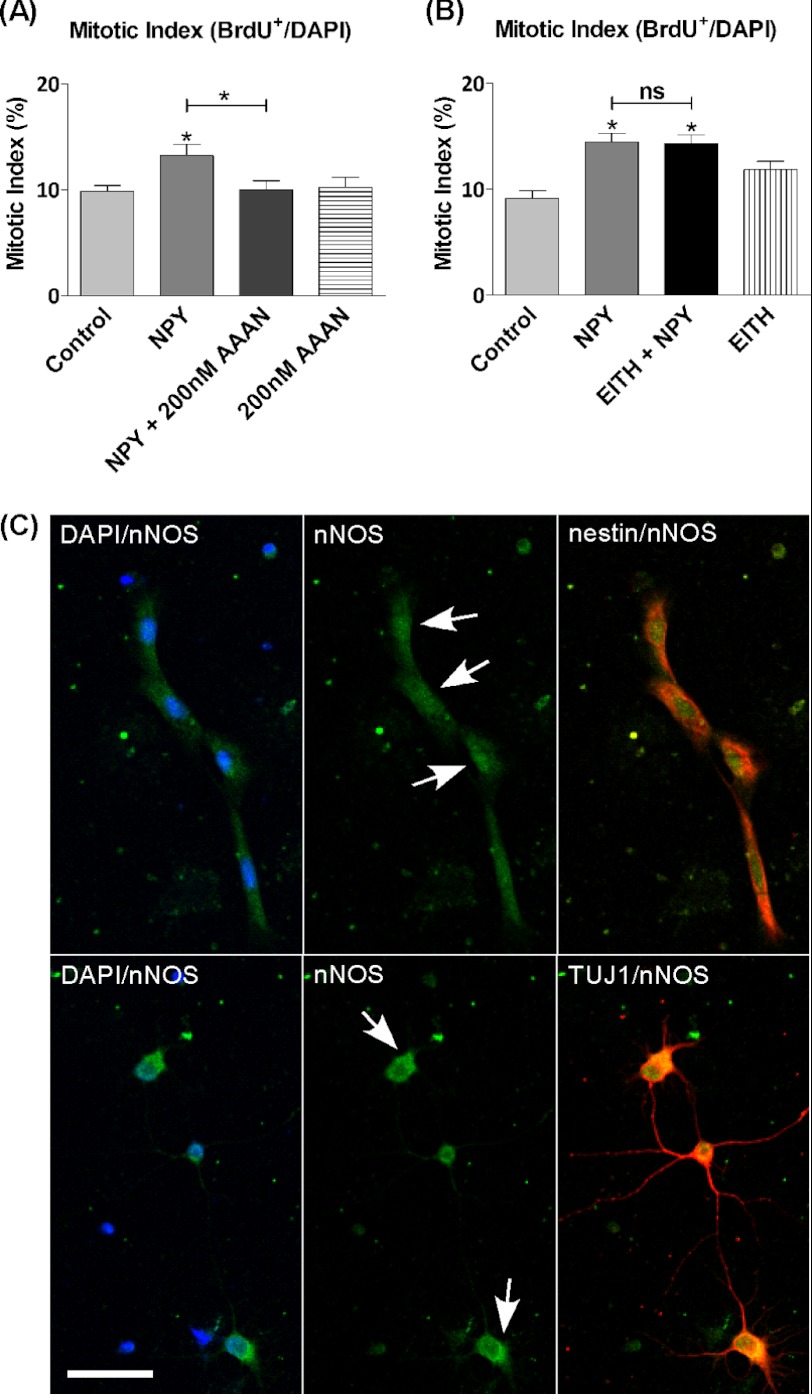
FIGURE 2.
nNOS is likely to mediate proliferative effect of NPY. nNOS and iNOS were inhibited using subtype selective inhibitors. Hippocampal cells were cultured under control conditions (NBA/B27/glutamine) (A) or control conditions and 1 μm NPY and/or 100 nm EITH (iNOS inhibitor) (B). On the 3rd day, BrdU and 1 μm NPY and/or 200 nm AAAN (nNOS inhibitor) (A) or BrdU (B) was added for the final 6 h. NPY induced a statistically significant increase in the mitotic index, which was reduced back down to control levels in the presence of AAAN (A) and unaffected by the presence of EITH (B). AAAN and EITH had no effects on basal proliferation rates on their own. Data represent mean ± S.E. based on a sample that represents at least 12 wells/condition from three different experiments. One-way ANOVA with Dunnett's multiple comparison test as compared with control condition was performed. *, p < 0.05. ns, not significant. C, each set of images represents fluorescence images captured on a confocal microscope separated into filter sets of DAPI/nNOS, nNOS, nNOS/nestin, or nNOS/class III β-tubulin (TUJ1) with DAPI in blue, nNOS in green, and cell phenotype nestin or class III β-tubulin in red. nNOS was localized throughout the soma and cytoplasm of both cell types, although staining showed more intense immunostaining located in the soma of nestin+ cells and cytoplasm of class III β-tubulin+ cells (arrows). Scale bar, 25 μm.

