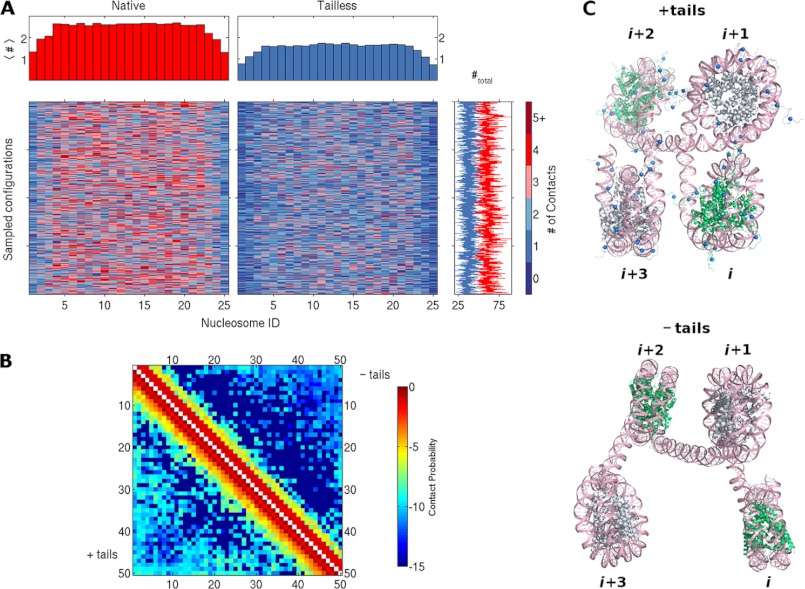
FIGURE 4.
Histone tails affect contacts and spatial arrangements of nucleosomes in simulated chromatin fragments. A, color-coded mosaic of the numbers and locations of close (≤15 nm) internucleosomal contacts detected in simulated chains bearing 25 evenly spaced nucleosomes with intact (left) or tailless (right) histones. The positions of nucleosomes are denoted by the numbers at the bottom of the images, and the number of contacts (#) are denoted by the scale on the right. The total number of contacts per simulated configuration, plotted to the right of each row, fluctuates around an average value of 60 for intact (red line) and 38 for tailless (blue line) nucleosomes. See supplemental Fig. S5 for mosaics of 4-, 7-, and 13-mers. B, color-coded map of the frequency of close contacts between all pairs of nucleosomes in simulated chains binding 50 regularly spaced nucleosomes. The color coding is based on a logarithmic scale to pinpoint the locations of rare, longer-range interactions, e.g. −5 denotes a frequency of 10−5. Note the distinctly different frequencies (colors) for the intact (+tails) nucleosomes plotted below the diagonal versus those for the tailless (−tails) nucleosomes plotted above the diagonal. See supplemental Fig. S6 for frequency counts. C, representative configurations of four-nucleosome chromatin fragments in simulated chains with intact (top) and tailless (bottom) histones. The DNA is shown in pink, with the phosphorus atoms on complementary strands depicted by ribbons and the bases drawn as stick figures. The histones of successive nucleosomes are shown alternately in green and silver; the blue spheres depict charge cluster sites on the histone tails (see supplemental Fig. S2).

