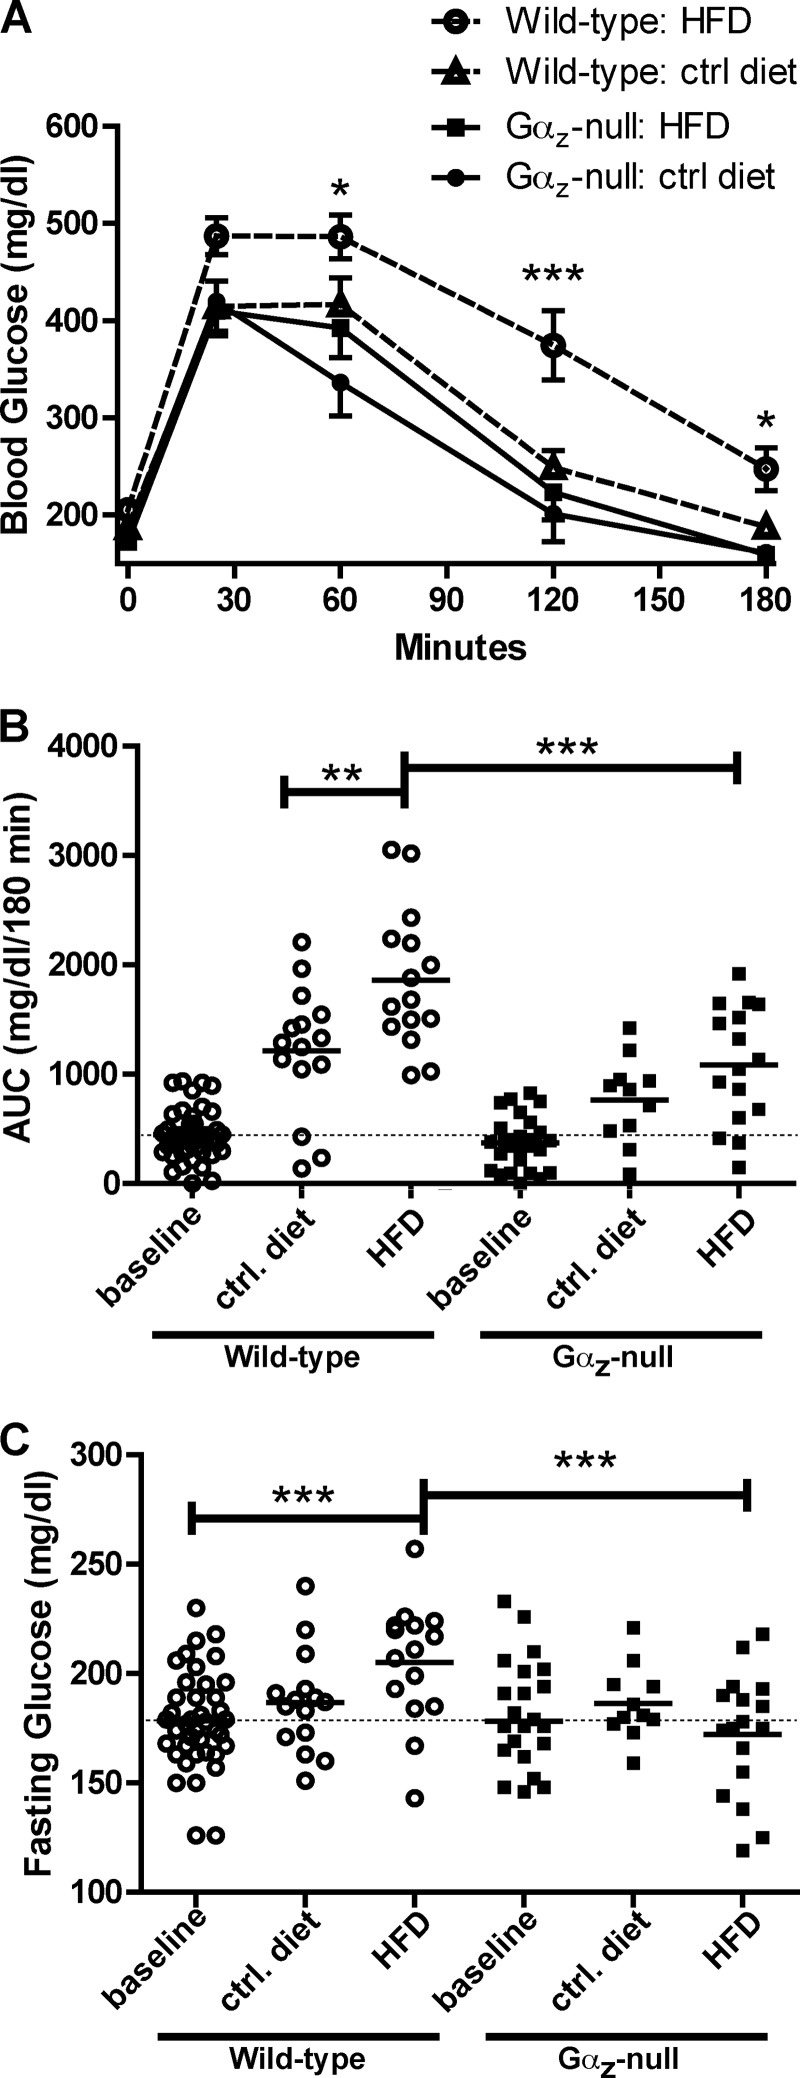
FIGURE 2.
Loss of Gαz normalizes glucose tolerance in mice fed the HFD. A, blood glucose values recorded during an IP-GTT (1 g/kg glucose) performed after 21–25 weeks on the HFD or control diet (wild type: control diet, n = 15; wild type: HFD, n = 17; Gαz-null: control diet, n = 12; Gαz-null: HFD, n = 15). The data were analyzed by two-way repeated measures ANOVA followed by Bonferroni post-test. B, area under the curve (AUC) measurements performed on IP-GTT curves at 11 weeks of age (base line; Fig. 1A) or at 21–25 weeks after beginning the DIO study. The data were analyzed by unpaired t test. C, fasting glucose levels taken at t = 0 during the IP-GTTs indicate a better maintenance of base-line glycemia in the Gαz-null mice with HFD feeding. The data were analyzed by unpaired t test. **, p < 0.01; ***, p < 0.001. ctrl, control.

