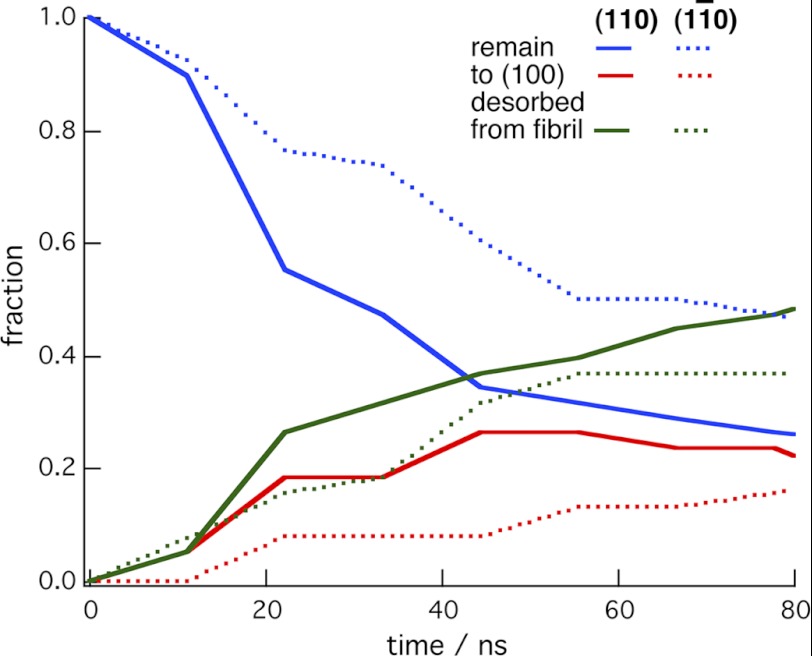
FIGURE 3.
Time evolution of the simulations with the CBM started on the hydrophilic surfaces of the 16-chain microfibril. The plots are the fractions of the 40 simulations in which the CBM remained on the same surface, transferred to the (100) surface, or desorbed from the microfibril. The solid lines are for the simulations started on the (110) surface, whereas the dotted lines were started on the (11̄0) surface. Fig. 1 shows the starting configurations and the initial CBM positions on the microfibril.

