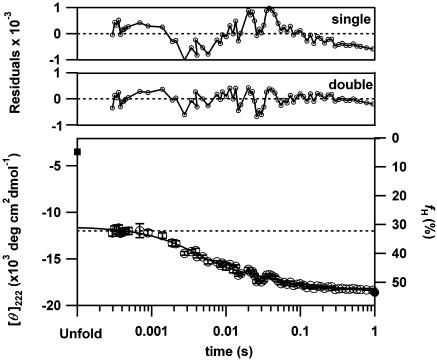
Fig. 1.
The time course of the change in mean residue ellipticity at 222 nm ([θ]222) for the folding of apoMb initiated by the pH-jump from 2.2 to 6.0 at 26°C (open circle). The filled square and circle represent [θ]222 for the unfolded and native states, respectively. The dotted line shows [θ]222 at pH 4.2. The line indicates a double exponential fitting (5 ± 0.5 ms and 49 ± 8 ms) of the kinetic data. The amplitudes of the burst, first, and second kinetic phases estimated from the fittings are –11,500 ± 330, –4,230 ± 230, and –2,420 ± 230 (deg·cm2·dmol–1), respectively. The residuals of the single and double exponential fittings are indicated in the upper graphs. The right axis represents helical content (fH) calculated from Eq. 1.

