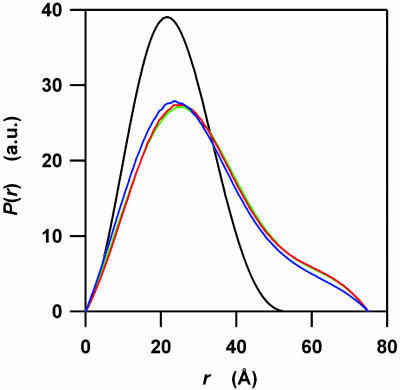
Fig. 4.
The pair distribution functions, P(r), calculated from the time-resolved scattering profiles of apoMb folding. The P(r) functions were calculated by using the gnom package (33) from the four scattering profiles indicated in Fig. 3. The blue, red, and green lines correspond to the functions for 300 μs, 600 μs, and 9 ms after initiating the folding, respectively. The black line corresponds to the native conformation. The maximum r value, Dmax, for the protein in its native state is 55 Å. All Dmax values for the transient species at 300 μs, 600 μs, and 9 ms are 75 Å. To clarify the differences between P(r) functions, they were normalized to have a constant integral area.

