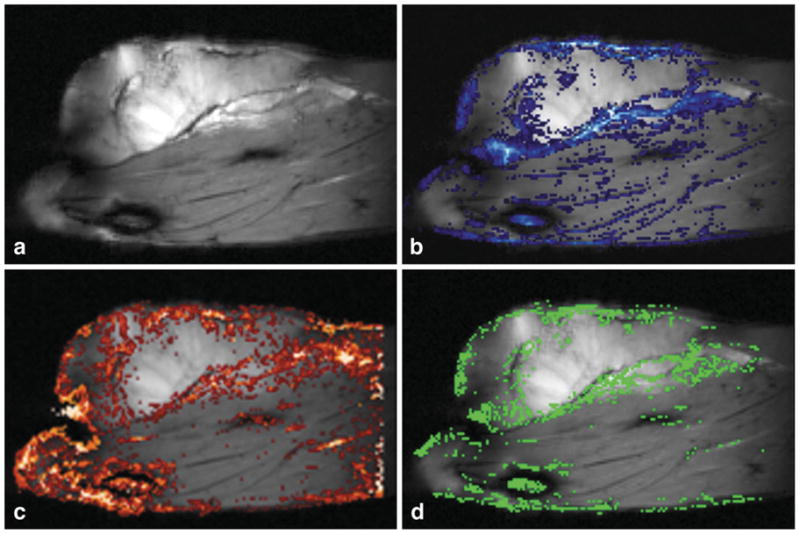
FIG. 3.

a: Water PH image. b: Water PH image with GRE differences overlaid (blue scale: dark to light blue is a high signal in difference images). c: Water PH image with thresholded FCI-MIP overlaid (red scale: dark to light red indicates lower to higher signal intensities). d: The water PH image with pixels where GRE difference images and HiSS data agree superimposed in green. The greatest concentrations of correlated pixels are in the tumor rim, which is the typical anatomical location of tumor microvasculature.
