
Figure 1.
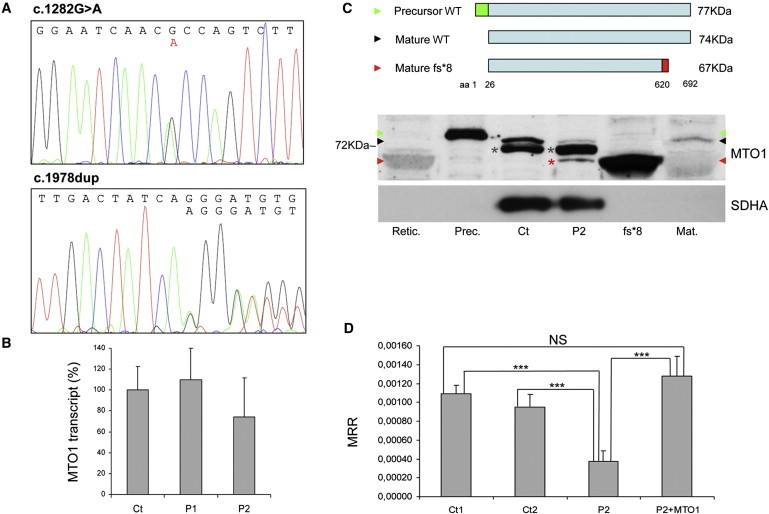
MTO1 Mutations
(A) Electropherograms of MTO1 of Pt2 showing the c.1282G>A (left) and c.1858dup (right), both in heterozygosis.
(B) Real-time PCR on retrotranscribed cDNA from fibroblasts of individuals 1 (P1) and 2 (P2). The amount of MTO1 transcript (normalized to GAPDH levels) is comparable in mutant versus WT control samples (Ct), indicating no mRNA decay. Data are represented as mean ± SD.
(C) Western-blot analysis of MTO1. Top: schematic representation of the precursor WT MTO1 (isoform a), its mature species after cleavage of a predicted 25 aa mitochondrial targeting sequence in the N terminus, and the mature p.Arg620Lysfs∗8 mutant species. Bottom: Western-blot analysis on isolated mitochondria. Retic.: reticulocyte lysate used for in-vitro protein synthesis; Prec.: in-vitro-translated 77 kDa MTO1 precursor protein (green arrowhead); Ct: isolated mitochondria from control fibroblasts; P2: isolated mitochondria from individual 2 fibroblasts; fs∗8: in-vitro-translated 67 kDa mature protein carrying the truncating p.Arg620Lysfs∗8 variant (red arrowhead); Mat.: in-vitro-translated 74 kDa WT mature MTO1 (black arrowhead). A faint crossreacting band is visualized in mt P2 sample (red asterisk), corresponding to the mature p.Arg620Lysfs∗8 truncated protein. An unspecific signal is present in mt samples (gray asterisks). The position of the 72 kDa molecular weight marker protein is also indicated. SDHA was used as loading control.
(D) MRR measured in immortalized fibroblasts from Pt 2, in naive condition (P2) or overexpressing MTO1 (P2+MTO1), and in control subjects (Ct1, Ct2). MRR values are expressed as pMolesO2/min/cells. Data are represented as mean ± SD. Two-tail, unpaired Student's t test was applied for statistical significance. ∗∗∗: p < 0.001.