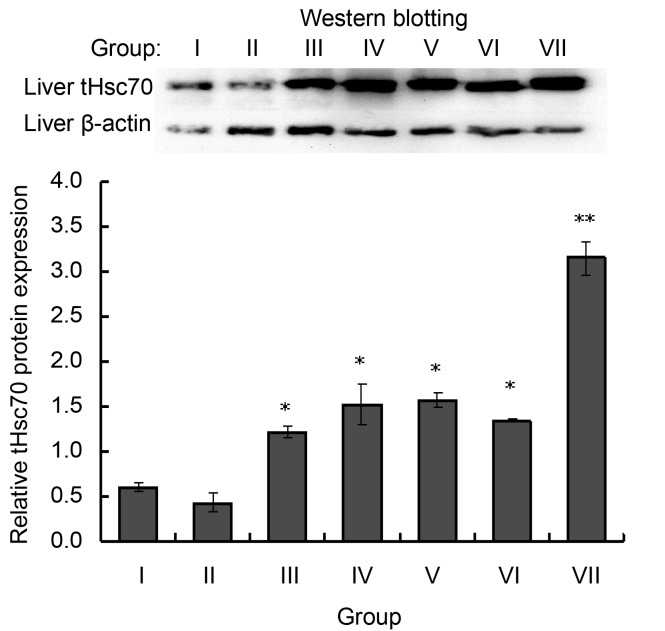
Fig. 7.
Western blotting analysis of tHsc70 expression in the liver of P. sinensis after heat stress for 1, 2, or 4 h with 1-h adaptive recovery at 25 °C (Groups V, VI, and VII) or without adaptation (Groups II, III, and IV)
Error bars represent the mean±SD (n=3). * P<0.05 and ** P<0.01 indicate statistical difference as compared with the untreated control

