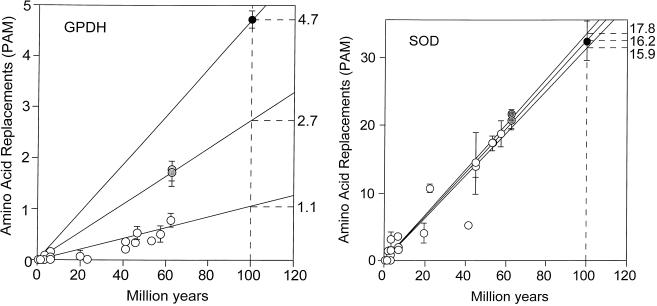
Figure 2.
Rate of amino acid replacement in fruit flies for the enzymes GPDH (Left) and SOD (Right). Open circles represent comparisons between species of Drosophila with each other (or with Scaptodrosophila); gray circles, between species of Chymomyza and Drosophila; solid circles, between Ceratitis and all other species; bars represent standard errors. It is apparent that a single straight line cannot provide a reasonable fit for all GPDH points; the rates shown on the right are amino acid replacements in units of 10−10 per site per year. The SOD rates are 16.2 for the Drosophila subgenera, 17.8 for the comparisons with Chymomyza, and 15.9 for the comparisons with Ceratitis; the two Chymomyza points are slightly displaced right and upwards for clarity. The species of Drosophila include 18 in addition to those listed in Table 1.

