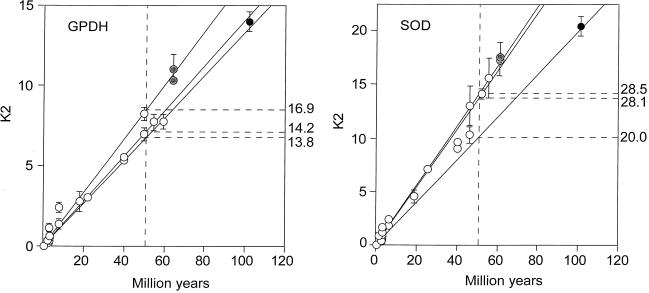
Figure 3.
Rate of nucleotide substitution (K2) in fruit flies for the genes Gpdh (Left) and Sod (Right). Symbols and other conventions are as in Fig. 2. The K2 units are nucleotide substitutions × 10−10 per site per year, estimated by Kimura’s (22) two-parameter method; the rates on the right are in the same units, although their intercepts have been drawn at 50 My for clarity. The three rates are fairly similar, so that all points could have been subsumed within the same regression line, except perhaps for the Sod Ceratitis comparisons.

