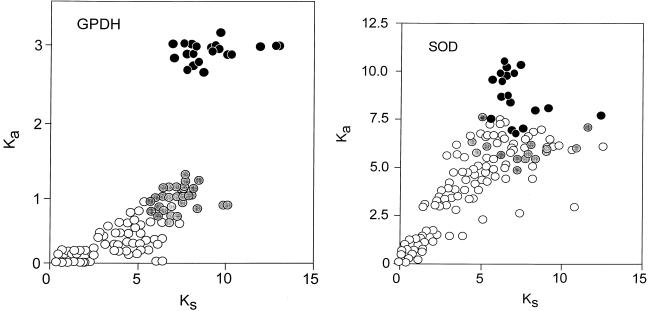
Figure 4.
Rate of nonsynonymous (Ka) versus synonymous (Ks) substitutions in Gpdh (Left) and Sod (Right), estimated according to Li (23). Symbols and other conventions are as in Figs. 2 and 3, except that the Ka scale is in units of substitutions × 10−9 per site per year. In the case of Gpdh the correlation between nonsynonymous (replacement) and synonymous substitutions for comparisons with either Chymomyza or Ceratitis is not homogeneous with the correlation for the comparisons between Drosophila species; for Sod the correlation is more nearly homogeneous, although the dispersion is high.

