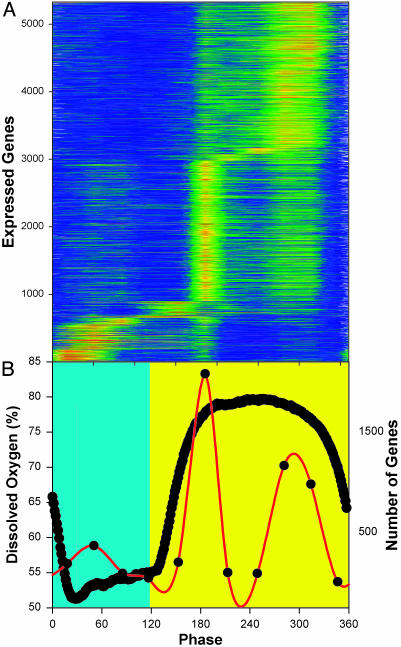
Fig. 2.
Average expression levels from three cycles of the respiratory oscillation. Color contour (intensity) maps of the expression levels of the 5,329 expressed genes are shown for all 32 RNA samples through three cycles of the DO oscillation. (A) The average expression level for the three biological replicates are shown. High levels of expression are orange, and low levels are blue. Genes were scored as present based on the Affymetrix default settings and included in the analysis if at least 1 of the 32 was scored as present in each of the three cycles. Genes are defined according to the most recent assignments (23). Values shown here were scaled by dividing the average expression level for each gene into each of the time-series samples for that gene. Transcripts were ordered according to their phase of maximum expression in the average of the three replicates. This same scaling and ordering was used in Fig. 7. Samples are identified according to their phase in the cycle (0–360°/cycle). Sample phases are shown in reference to the DO curve (thick black line, B). The reductive phase is taken to be the period of minimal oxygen consumption (maximum DO, yellow background) in the interval between the minimum DO levels, and the respiratory phase is shown against a blue-green background. (B) Summary of the results for the time of maximum expression (red line) for the transcripts of A. Color scale: orange-red =>1.6 and dark blue = <0.8.

