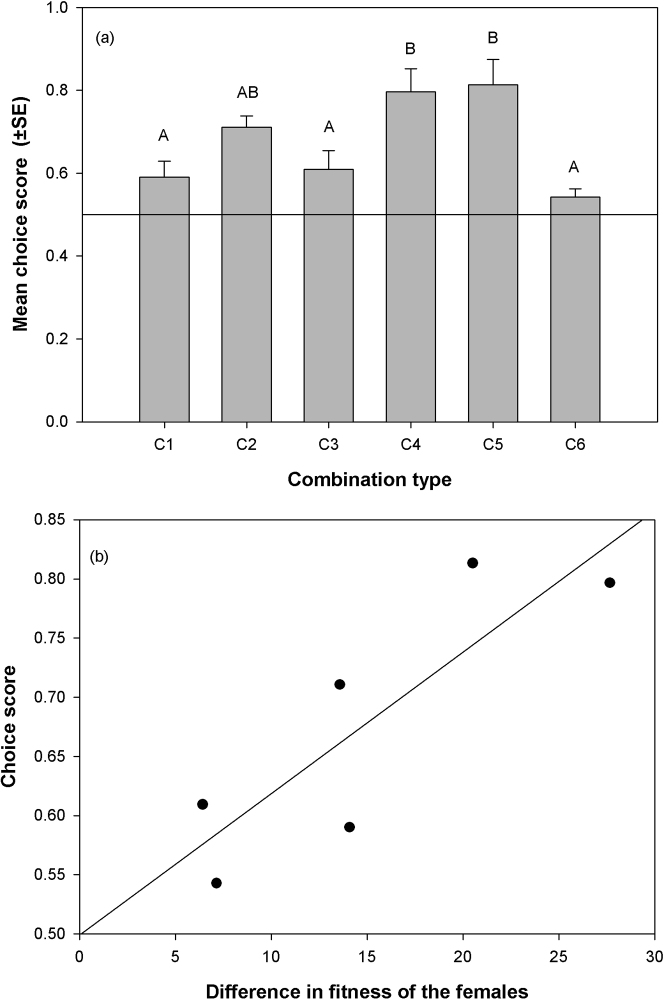
Figure 4. Choice scores and variance in female quality: (a) Mean Choice Scores of all the combinations (C1: O/HY vs.O/LY, C2: Y/HY vs. O/HY, C3: Y/LY vs. O/HY, C4: Y/HY vs. O/LY, C5: Y/LY vs. O/LY, C6: Y/HY vs. Y/LY).
Bars not sharing common letters are significantly different. The horizontal line indicates expected choice score if there is no mating bias (CS = 0.5). Except C6, in all combinations Choice Score was significantly greater than this expected value of 0.5 (p<0.04 for all combination). Choice score in C6 was marginally not-significantly different from 0.5 (p = 0.053); (b) Regression between Choice Score and difference in fitness of the females. Slope = 0.012, r2 = 0.73, p = 0.03.

