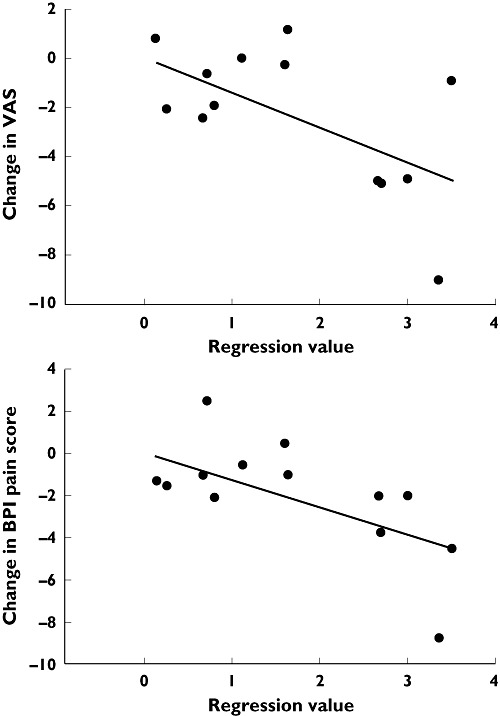
Figure 4.

Correlation between regression value (representing the overall alteration of the EEG) and changes in clinical scores for pain diary based on the visual analogue scale (VAS) and the pain composite score in brief inventory short-form (BPI) for patients receiving pregabalin
