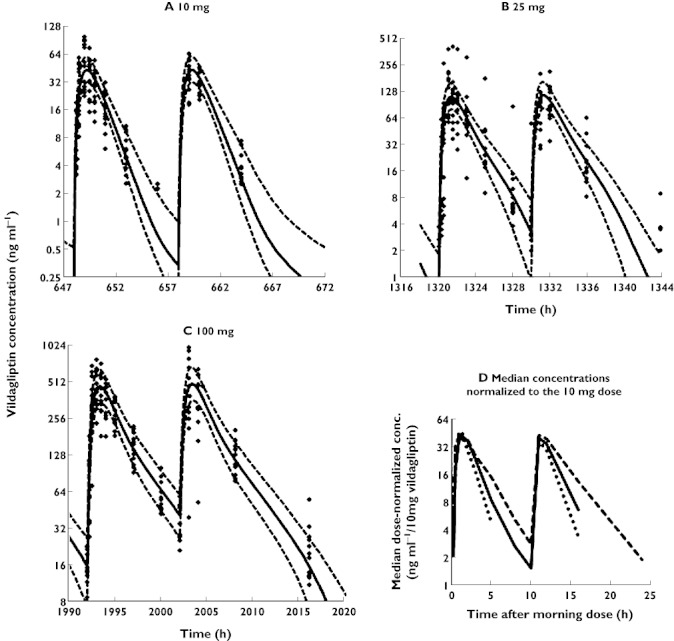
Figure 2.

(A–C) Visual predictive checks for plasma concentrations of vildagliptin. The plots show the observed data (filled diamonds), the median predicted concentrations (solid line) and the 80% prediction interval (10–90% percentile, broken lines). In order to show all data from each dose level in the same plot it was assumed in the graphs that all virtual subjects received the doses in the same sequence. The doses on the observation days as shown in the figure were at 648 and 658 h for the 10 mg dose, 1320 and 1330 h for 25 mg and 1992 and 2002 h for 100 mg. The actual sequence of dosing in the randomized clinical trial for each individual patient was observed for all estimation model runs. (D) Median vildagliptin concentrations normalized to the 10 mg dose. Only four of 13 patients had a quantifiable concentration at 8 h after the 10 mg dose and only five of 13 patients had a quantifiable concentration at 24 h after the 25 mg dose. Those two time points were left out of the figure as otherwise the slopes of the curves would be biased. 10 mg ( ); 25 mg (
 ); 100 mg (
 )
)
