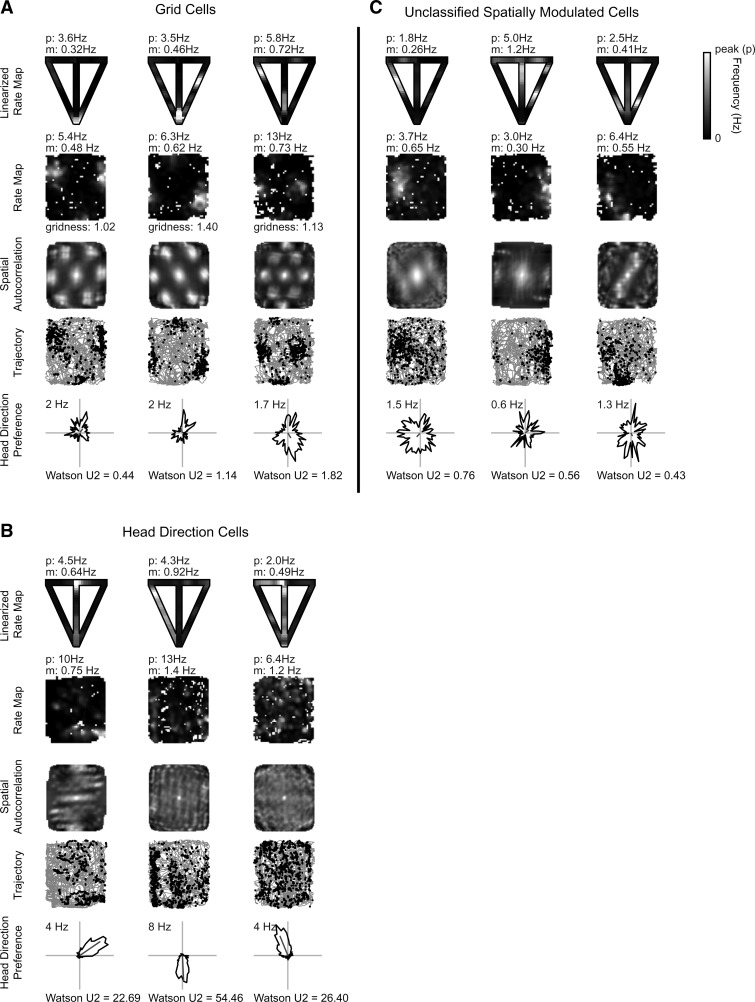
Figure 2.
Examples of spatial cells recorded on the T-maze and open field. Panels A, B, and C show three grid cells, three head direction cells, and three spatially nonselective cells, respectively. T-maze recording (panel row 1): reconstructed T-maze rate map from linearized position with mean (m) and peak (p) firing rate shown. Open-field recording (rows 2–5): mean (m) and peak (p) firing rate shown above the rate map (panel row 2); spatial autocorrelation with gridness score for grid cells only (panel row 3); trajectory (gray line) of rat with spike locations (black dot) overlaid (panel row 4); and polar rate map showing head direction preference with maximum firing rate above and Watson U2 score below (panel row 5).

