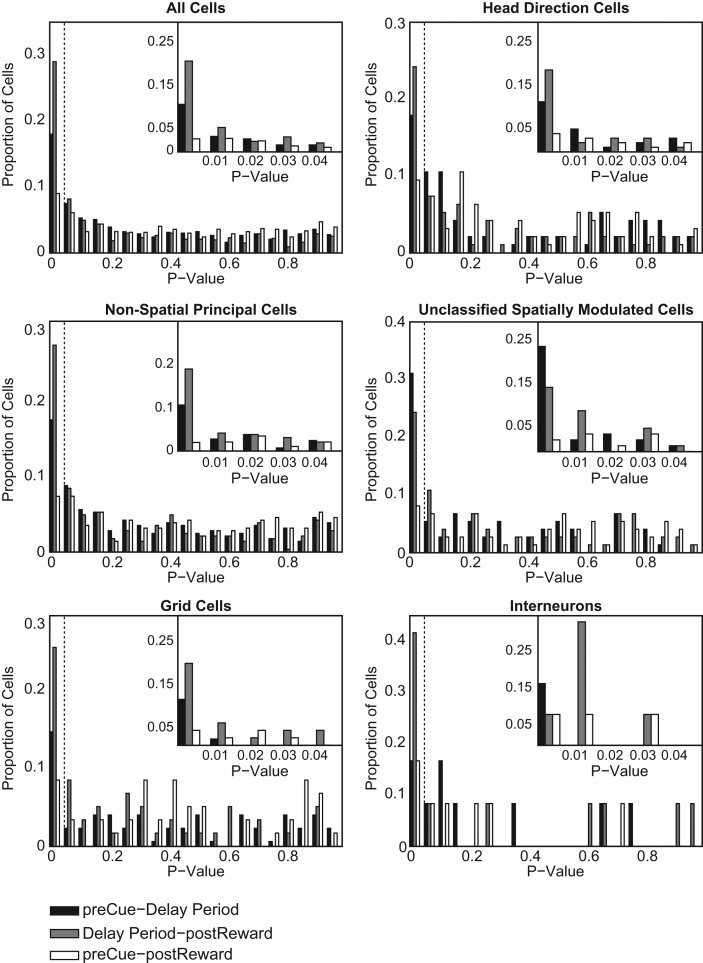
Figure 5.
Histograms of P-values for three comparisons in spike rate for all recorded neurons and for spatial and nonspatial subtypes from all three rats. The insets show the data for P < 0.05 in smaller bin sizes. See Materials and Methods for interval definitions. (Black) Two-tail t-test of the elevated spike-rate distribution 5-sec pre-cue interval compared to delay period, (gray) two-tail t-test of elevated spike-rate distribution 5-sec post-reward interval compared to delay period, (white) two-tail t-test of spike-rate distribution differences between 5-sec pre-cue and 5-sec post-reward intervals. All t-tests are corrected for multiple comparisons using the Holm-Bonferroni method.

