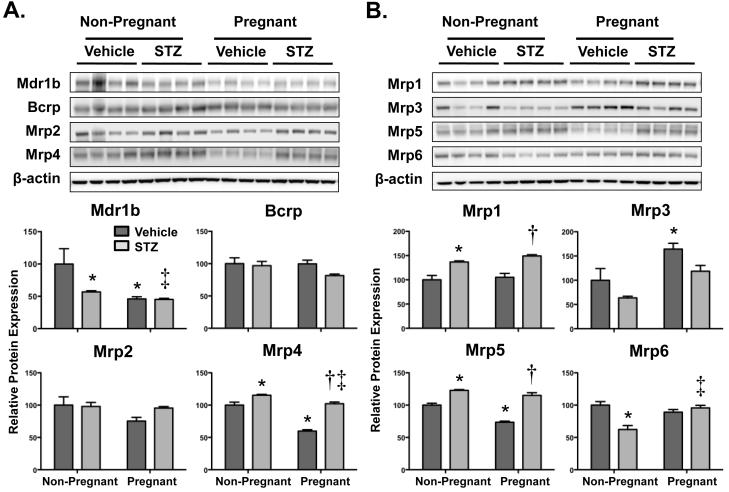
Figure 3. Renal protein expression of efflux transporters in vehicle- and STZ-treated mice during pregnancy.
Immunoblots are presented for (A) apical transporters and (B) basolateral transporters in the upper portion (protein loading amount 50 μg/lane). Protein band intensity was quantified by densitometry using an Alpha Innotech Fluorochem and presented as mean relative protein expression (normalized to the vehicle-treated non-pregnant experimental group) ± SE (n = 4 animals). β-actin was used as a loading control. Asterisks (*) represent a statistical difference compared to vehicle non-pregnant mice (p ≤ 0.05); Daggers (†) represent a statistical difference between vehicle and STZ-treated pregnant mice (p ≤ 0.05); Double daggers (‡) represent a statistical difference between STZ-treated non-pregnant and pregnant mice (p ≤ 0.05).

