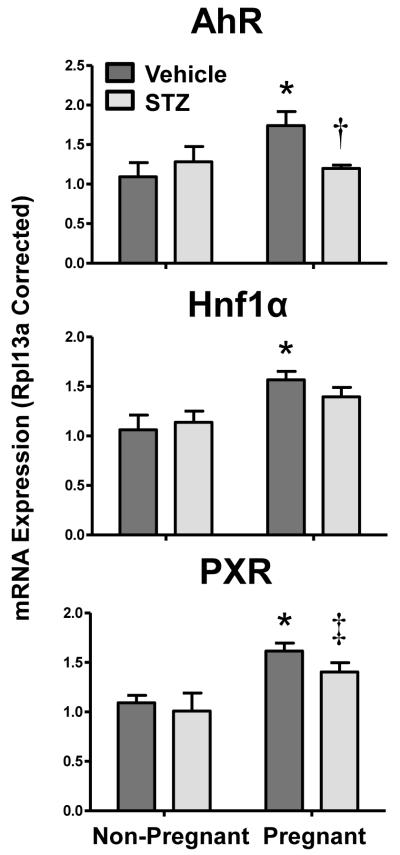
Figure 5. Renal mRNA expression of transcription factors in vehicle- and STZ-treated mice during pregnancy.
Total RNA was isolated from kidneys and mRNA levels were quantified using real-time quantitative PCR. The data are presented as means normalized to Rpl13a ± SE (n= 3-8 animals). Asterisks (*) represent a statistical difference compared to vehicle non-pregnant mice (p ≤ 0.05); Daggers (†) represent a statistical difference between vehicle and STZ-treated pregnant mice (p ≤ 0.05); Double daggers (‡) represent a statistical difference between STZ-treated non-pregnant and pregnant mice (p ≤ 0.05).

