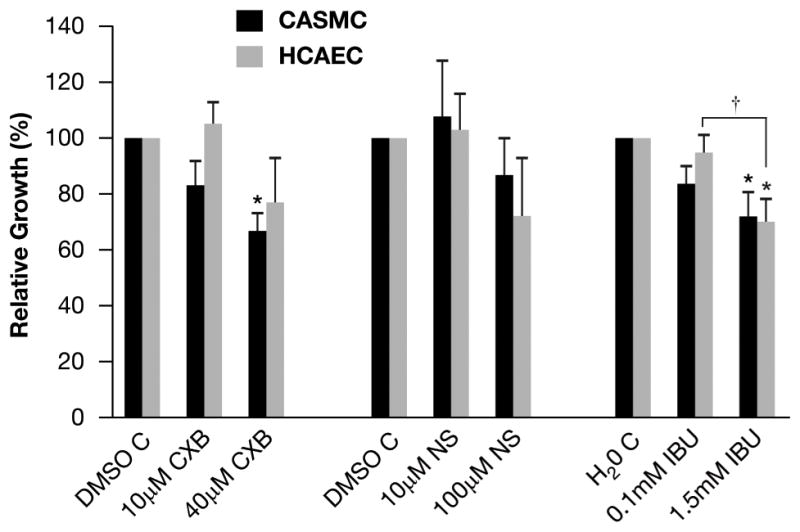
Fig. 1.

CASMC and HCAEC cell growth after treatment with NSAIDs. Cells were treated with CXB (10μmol/L and 40μmol/L), NS (10μmol/L and 100μmol/L) and IBU (0.1mmol/L and 1.5mmol/L) for 24h. Data points represent percent cell growth following NSAID treatment normalized to vehicle controls (mean ± SEM, n=3). The difference between low and high IBU was significant. †p<0.05
