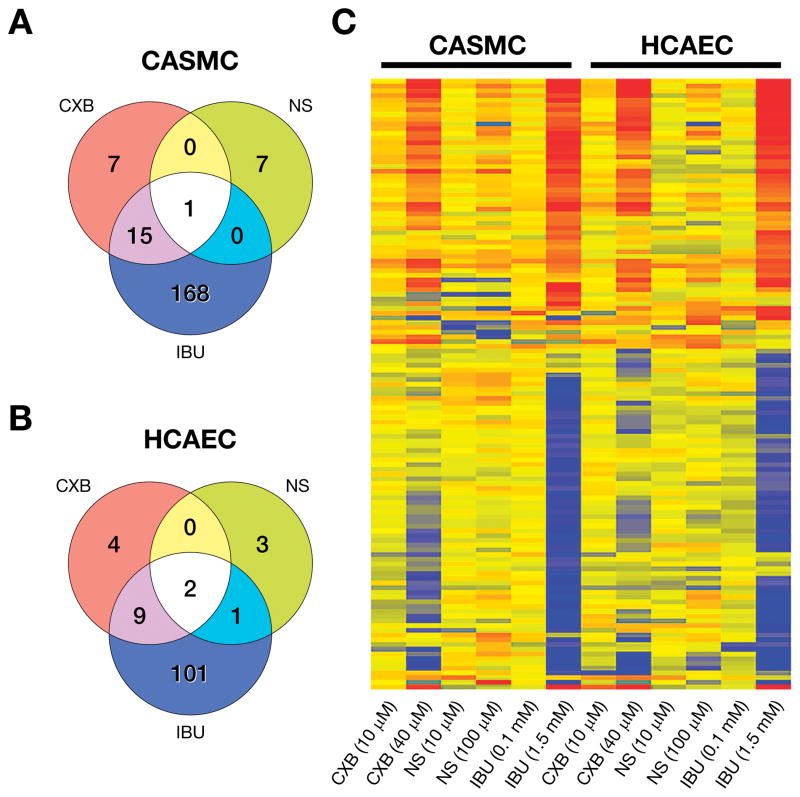
Fig. 4.
Venn diagrams depicting number of differentially expressed genes related to cardiovascular functions by CXB, NS and IBU in (A) CASMC and(B) HCAEC. (C) Heat map of cardiovascular genes identified by gene ontology classification and IPA in CASMC and HCAEC treated with low and high concentrations of NSAIDs. (See Supplemental Digital Content 3 for the microarray data for this figure).

