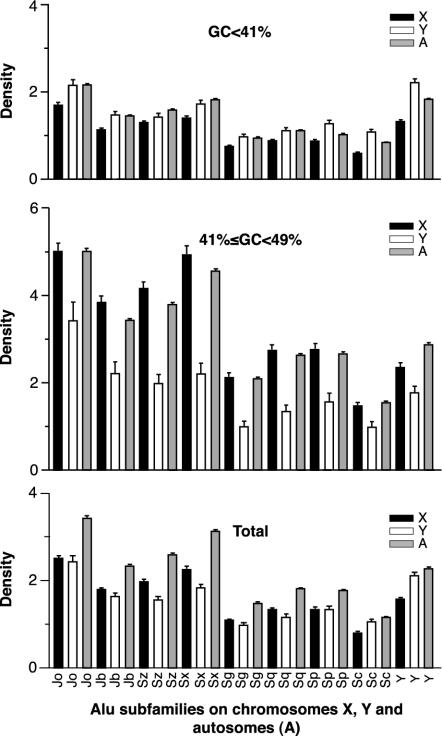
Fig. 5.
Densities of Alu elements in AT- and GC-rich regions and all regions combined on chromosomes X, Y, and autosomes. Each bar represents the average number of Alu per 50 kb of genomic DNA. Segments with GC content >49% are not included in these comparisons, because chromosome Y does not contain any significant DNA fragments with GC content over this limit. Higher error bars in GC-rich DNA reflect higher variations in Alu densities. The dataset is based on the July 2003 version of the human genome, with duplicated regions included.

