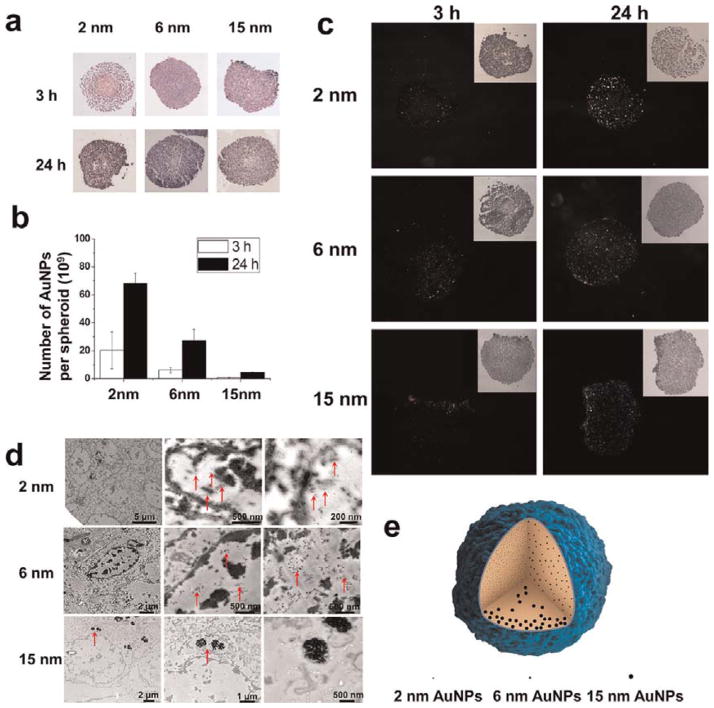
Figure 4.
Penetration of 1 nM AuNPs into tumor spheroids after treatment for 3 and 24 h. (a) Images of spheroids treated with nanoparticles of different sizes after HE staining. (b) ICP-MS analysis of the number of Au nanoparticles in each treated spheroid. (c) Dark field images of spheroids after culture with nanoparticles of different sizes. (d) Representative TEM images of the external and internal regions of spheroids treated for 24 h. Red arrows indicate the gold nanoparticles. (e) Schematic illustration of the penetration behavior of AuNPs of different sizes.

