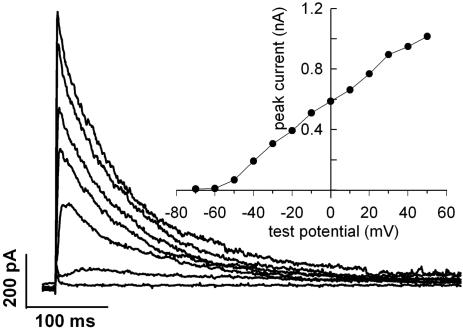
Fig. 2.
Whole-cell currents of an antigen-activated CTL. Potassium currents were elicited by depolarizing steps ranging from –70 to +50 mV in 10-mV increments. The depolarizing steps lasted for 2 s, of which the first 500 ms are shown for each trace. The cell was held at –120 mV for 50 s between the steps. Data were digitized at 2.5 kHz and filtered at 1 kHz. Every other trace was omitted from the figure for clarity. (Inset) The peak current-voltage relationship of this cell. Peak current was determined from each trace, corrected for ohmic leak, and plotted as a function of test potential.

