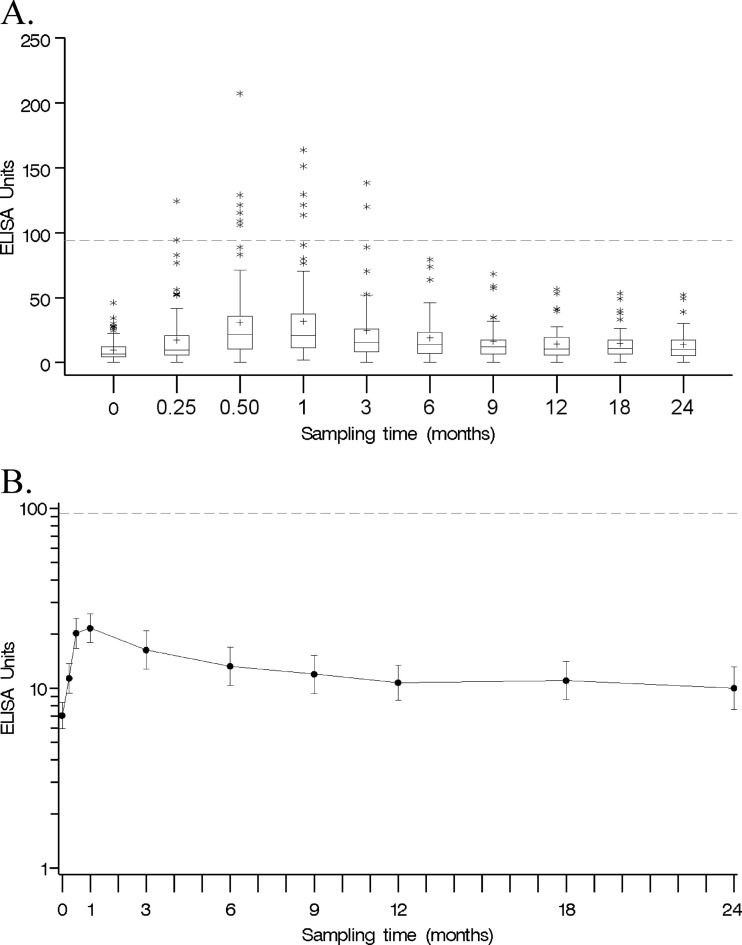
Fig 2.
(A) Box plot of antibody concentrations of 102 vaccinated subjects by sampling time. Each box displays the 25th percentile, median, mean (+), and 75th percentile. Whiskers are 1.5 times the interquartile range in length. Outliers are displayed as stars. Note that the x axis is not drawn to scale. The dashed line represents the proposed cutoff of 94 EU/ml. (B) Antibody GMCs (solid line) of 102 vaccinated subjects and 95% CIs of Tdap-vaccinated subjects by sampling time. The dashed line represents the proposed cutoff of 94 EU/ml.

