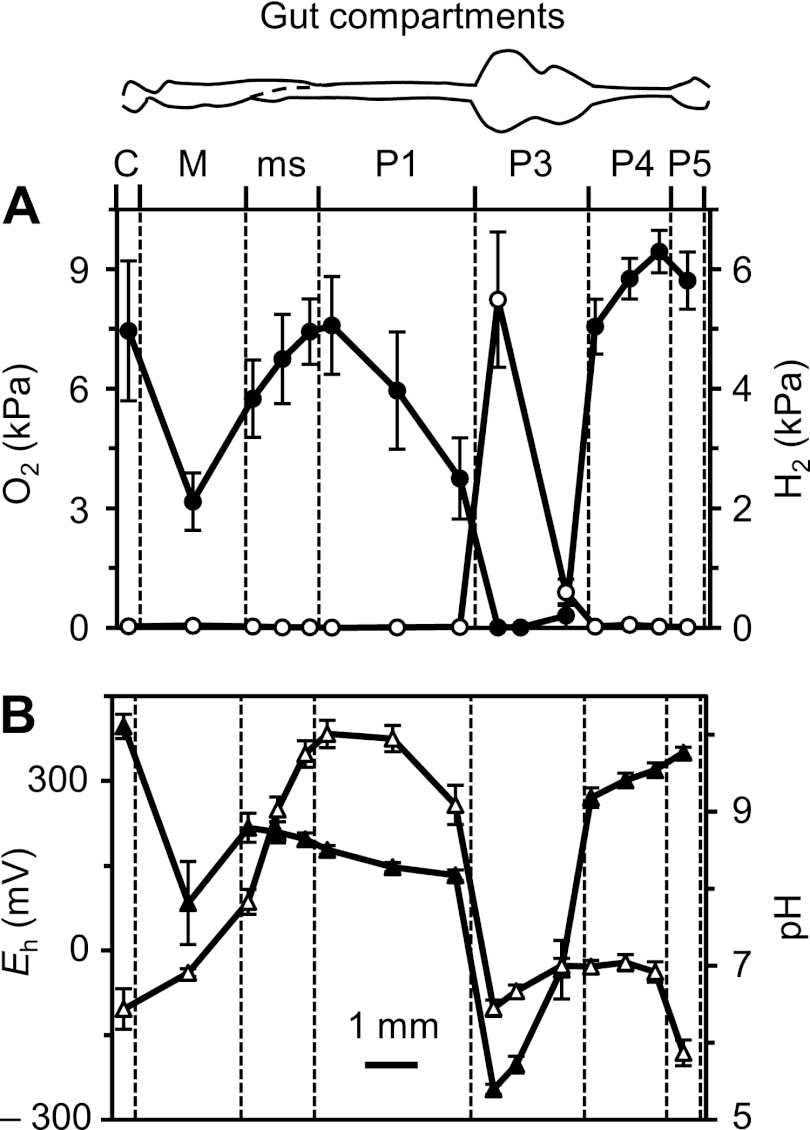
Fig 2.
Axial profiles of oxygen (●) and hydrogen (○) partial pressure (A) and of redox potential (▲) and pH (▵) (B) along the gut of Nasutitermes corniger, measured at the gut center. Values are means ± standard errors obtained with 8 to 12 termites (except for the crop, which was lost in about half of the preparations). For definitions of the abbreviations of the gut compartments, see the legend to Fig. 1.

