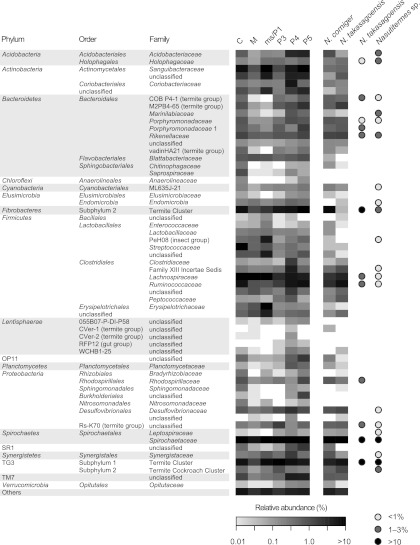
Fig 5.
Relative abundance of the major bacterial taxa in the different gut sections of Nasutitermes corniger (for definitions of the abbreviations, see the legend to Fig. 1) and in the total hindguts of N. corniger and N. takasagoensis. Classification is shown down to the family level (for genus level, see Table S1 in the supplemental material). The heat map uses a logarithmic scale to increase the visibility of low-abundance groups. The remaining sequences were extremely diverse (111 to 157 families), but each represented less than 1% of the community in the respective compartment (see Table S1 in the supplemental material). The families represented in previously published clone libraries of N. takasagoensis (26) (total gut) and a Nasutitermes sp. (73) (P3 lumen) are shown for comparison (shading of circles indicates relative abundance).

