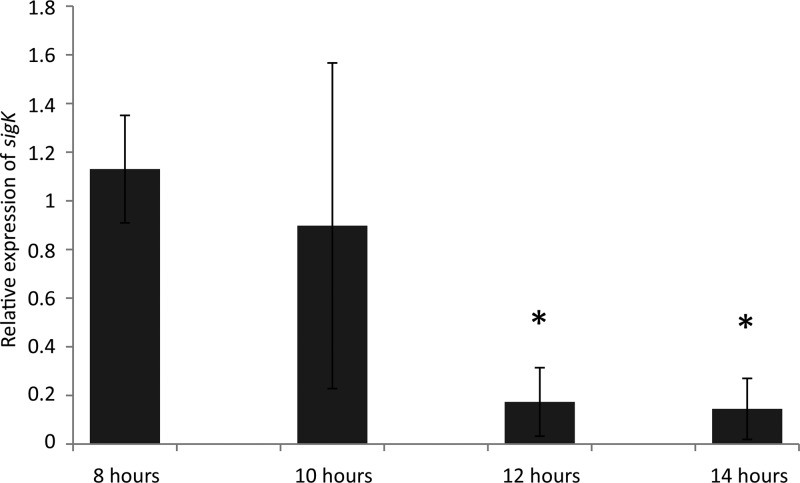
Fig 3.
qRT-PCR analysis of sigK transcription levels at 8, 10, 12, and 14 h of growth calibrated to the transcription level at 8 h. The 16S rrn gene was used as a normalization reference. Error bars indicate the standard deviation of three replicate cultures. *, statistically significant differences (P < 0.05, two-tailed Student's t test) between time points relative to 8 h.

