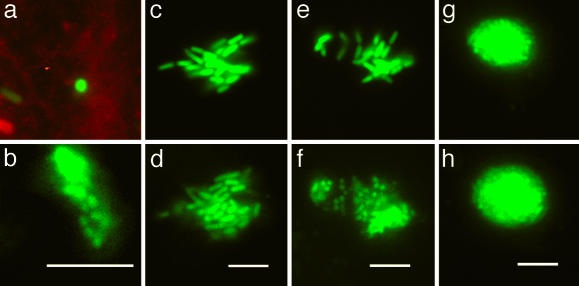
Fig. 1.
Maturation of an IBC. These micrographs depict three stages of the developmental program of UPEC during the acute infection. GFP-producing bacteria were visualized by fluorescence videomicroscopy to monitor the events in real time by using r-WGA as a cell surface marker as described in the text. Each pair of micrographs depicts events observed in different superficial umbrella cells. Animated versions are available in Movies 1–3, which are published as supporting information on the PNAS web site. (a) At 2 h after infection, a single bacterium (green) is perpendicular to the bladder cell surface (red) and invades the cell over 10 min. (b) After 12 h, this bacterium formed an intracellular microcolony ≈2 μm below the surface. (c and d) The morphology and growth of the early IBC are depicted as snapshots taken 42 min apart. (e and f) Maturation to the middle IBC is depicted in snapshots taken 100 min apart. (g and h) Growth and architecture of the middle IBC are depicted as snapshots taken 42 min apart. (Scale bars = 10 μm.)

