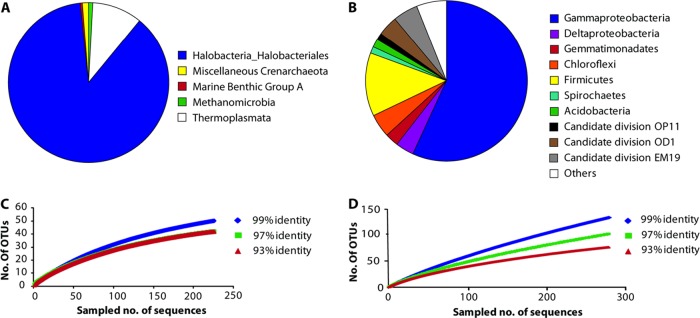
Fig 4.
(A and B) Classification of 231 archaeal (A) and 299 bacterial (B) full-length 16S rRNA gene sequences retrieved from a 0- to 10-cm composite sample of Lake Kasin. (C and D) Rarefaction curves for the archaeal and bacterial sequences from the respective clone libraries for three different sequence identity cutoff values (99%, 97%, and 93%). The archaeal rarefaction curve for the 97% cutoff value in C is not visible because it exactly resembles the 93% curve. Rarefaction curves were calculated with the program MOTHUR (75).

