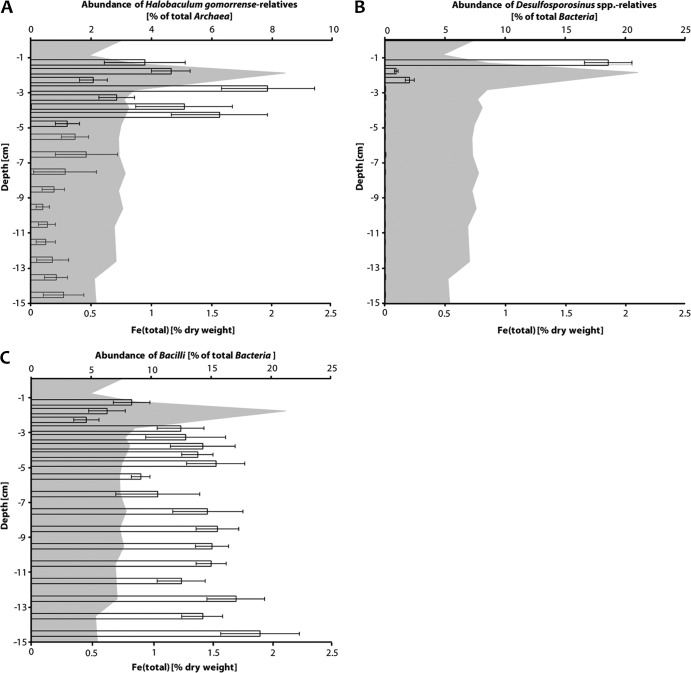
Fig 6.
Changes in relative abundance of potential Fe(III)-reducing taxa in a sediment profile of Lake Kasin. Bars indicate the abundance of Halobaculum gomorrense relatives (A), Desulfosporosinus sp. relatives (B), and Bacilli (C) relative to total Archaea (A) or total Bacteria (B and C) cell numbers for each sediment layer. Error bars refer to standard deviations of six individual qPCR measurements recorded in triplicate during two independent runs. The gray-shaded area in the background shows Fe (total) concentrations in % dry weight of the sediment.

