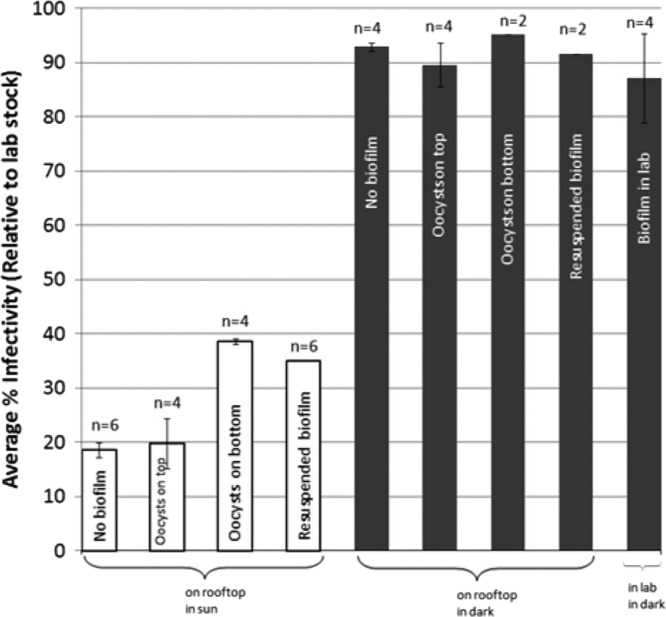
Fig 1.

Summary of oocyst infectivity results for solar exposure experiments on July 9, July 15, and August 25. White columns are light-exposed treatments. Gray bars are dark control treatments. Lab stock infectivity for each experiment was 5.8% (July 9), 5.3% (July 15), and 10.4% (August 25). The July 9 and July 15 experiments were performed with the same oocyst lot. n, number of individual flow chambers.
