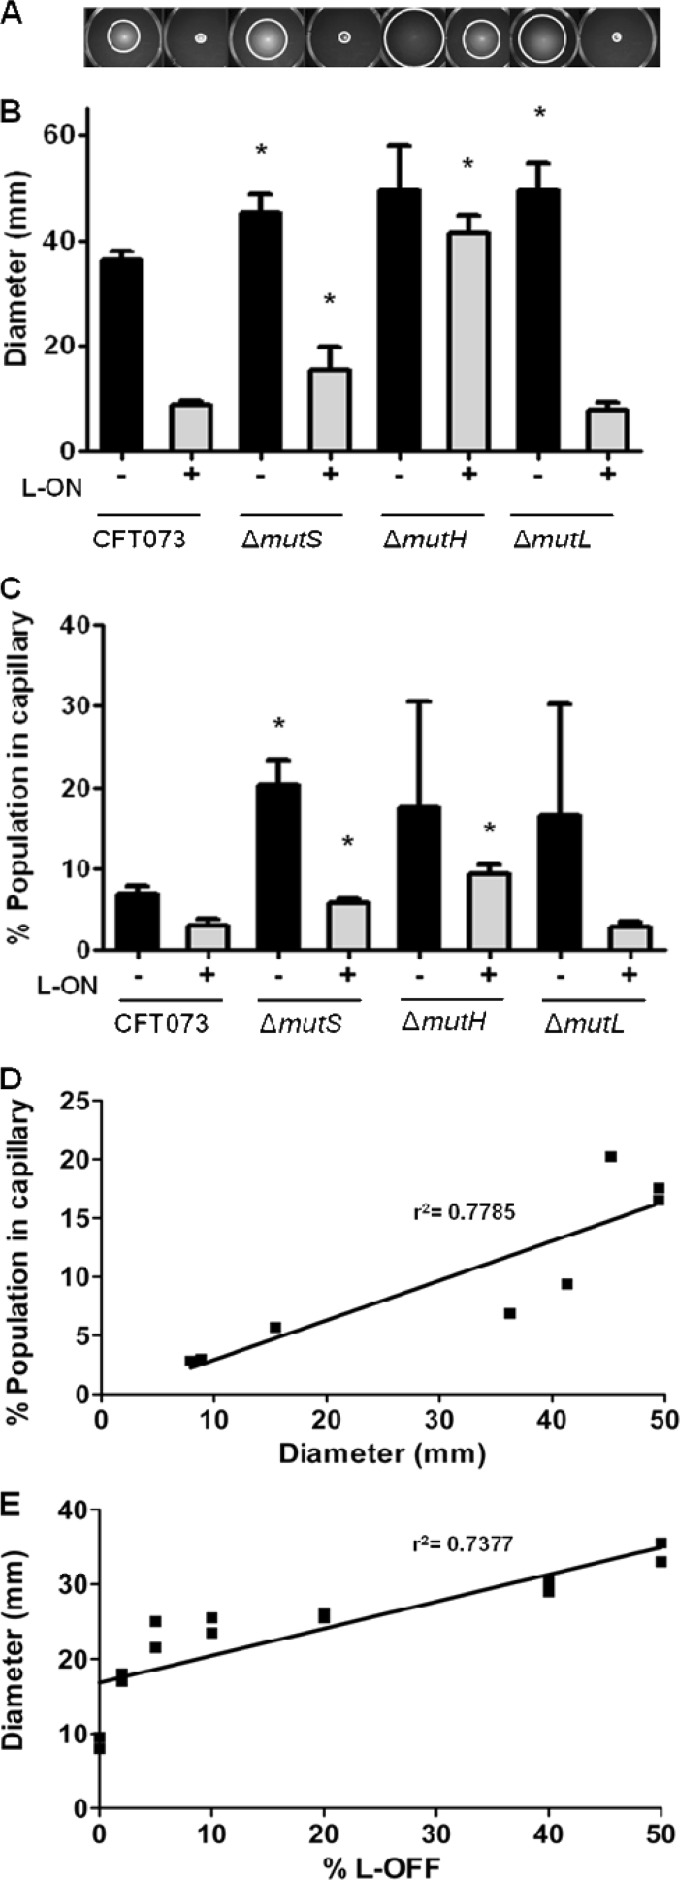
Fig 2.
Analysis of motility, percentage of motile bacteria within a population, correlation analysis between soft-agar motility, and percentage of motile bacteria within a population of CFT073 MMR mutants in wild-type and fim L-ON backgrounds and analysis of motility of mixed cultures with CFT073 fim L-ON and CFT073 fim L-OFF. (A) Motility of MMR mutants in soft agar are shown. (B) Bar graph representation of swimming motility diameters of motile deletion mutants. (C) Graphical representation of the percentage of motile bacteria within the populations of MMR mutants using the modified capillary assay. (D) Correlation between the average soft-agar swimming diameter and the average percentage of the population in a capillary. There is a positive correlation between soft agar motility and capillary motility, where the slope has a significant deviation from zero (P = 0.0037). (E) Measurement of swimming motility diameters from soft agar plates of mixed cultures starting with 100% nonmotile fim L-ON and 0% motile fim L-OFF strains and going up to 50% fim L-ON and 50% fim L-OFF. The line represents the best-fitting regression line. The slope has a significant deviation from zero (P = 0.0013). (B and C) The “+” and “−” signs indicate the fim L-ON status of the CFT073 background; “+” represents CFT073 fim L-ON, and “−” represents CFT073 wild type. The data represent the averages of at least three separate experiments. Error bars represent the SEM. Significant differences between MMR strains compared to parental strains were determined using a paired Student t test. *, P < 0.05.

