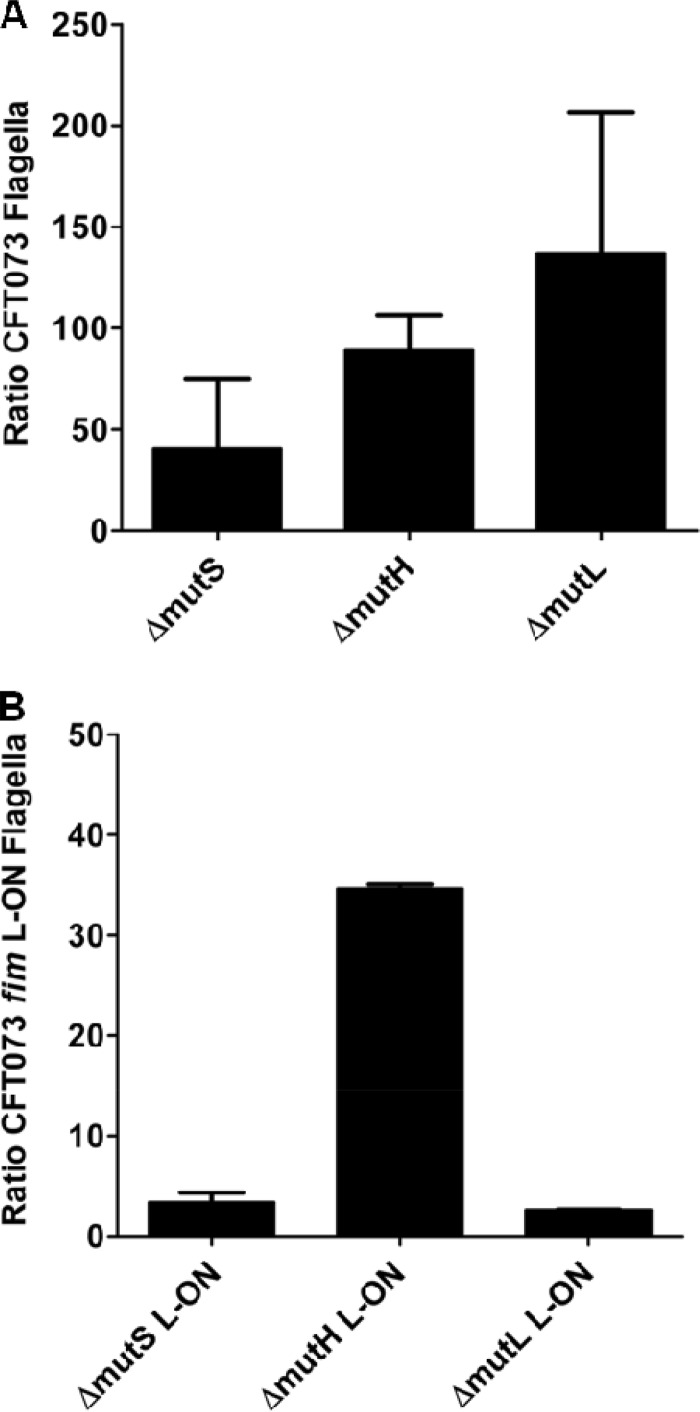
Fig 5.
Immunofluorescence analysis of surface flagellum expression of motile MMR mutants in wild-type CFT073 and CFT073 fim L-ON backgrounds as a ratio of the parental strain. (A) Bar graphs represent the average counts of flagella per MMR mutant bacterium in a CFT073 wild-type background as a ratio of average wild-type flagella per bacterium. (B) Graphical representation of average counts of flagella per mismatch repair mutant bacterium in CFT073 fim L-ON background as a ratio of average CFT073 fim L-ON flagella per bacterium is also shown.

