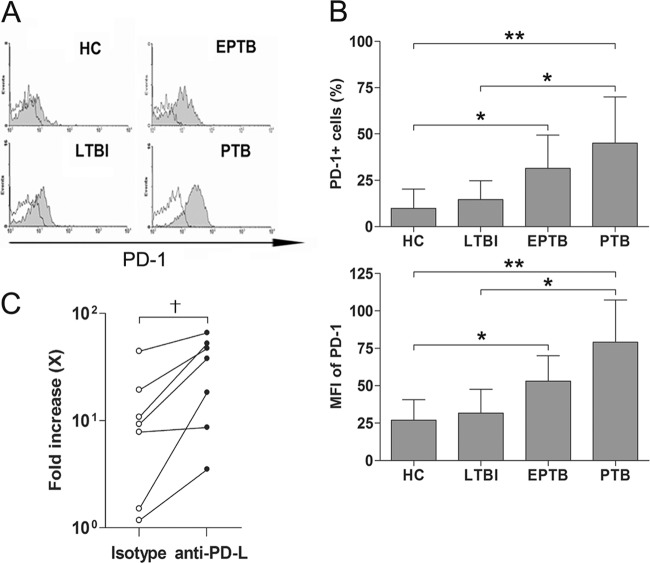
Fig 5.
Elevated PD-1 expression in NKT cells in EPTB and PTB patients. (A) Representative histograms on PD-1 in the NKT cell population. Freshly isolated PBMCs were stained with PerCP-conjugated anti-CD3, APC-conjugated anti-6B11, and PE-conjugated anti-PD-1 MAbs and then analyzed by flow cytometry. Shaded regions represent anti-PD-1 MAb, and open regions represent isotype control MAb. (B) Percentages of PD-1-expressing cells and MFIs of PD-1 in NKT cells from 8 age- and sex-matched HCs, 6 LTBI subjects, 6 patients with EPTB, and 6 patients with PTB are shown. (C) Changes in the proliferative responses of NKT cells in the presence of anti-PD-L Abs. Freshly isolated PBMCs from 4 patients with EPTB and 3 patients with PTB were stimulated with α-GalCer in the presence of anti-PD-L1 plus anti-PD-L2 Abs or isotype control as described in Materials and Methods, and then proliferation indices were determined by flow cytometry. Results are presented as means ± SDs. *, P < 0.05 by Mann-Whitney U test; **, P < 0.01 by Mann-Whitney U test; †, P < 0.05 by Wilcoxon signed-rank test.

