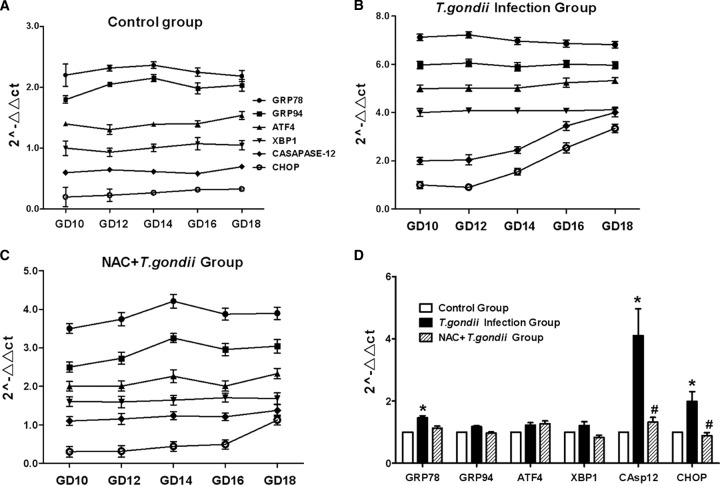
Fig 6.
ERS levels in placenta tissues of various gestational days from three groups. (A to C) The markers of ERS were detected by real-time RT-PCR in each group, as indicated. The data were normalized to those measured at GD10 in the same group. To prevent overlap, the data sets were moved by the same data units. (D) All samples across gestational days from the three groups were reanalyzed by one-way ANOVA and the SNK multiple comparison posttest. Values represent the mean ± SD of 30 samples per group. #, P < 0.01 versus T. gondii infection; *, P < 0.01 versus the control.

