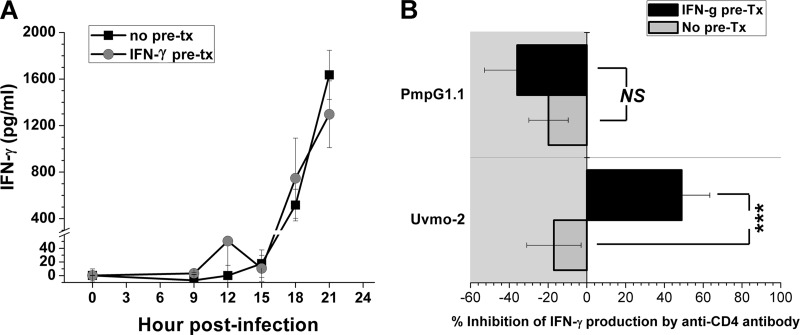
Fig 5.
Processing and presentation of the PmpG303-311 epitope by infected epithelial cells. (A) C57epi.1 monolayers, untreated (no pre-tx) or pretreated (pre-tx) with IFN-γ (10 ng/ml for 14 h) in 96-well plates, were infected with C. muridarum (3 IFU per cell) over staggered intervals to generate mock (0-h)-infected and 9-, 12-, 15-, 18-, and 21-h-infected monolayers at endpoint. The infected monolayers were cocultured with 5 × 10⁴ PmpG1.1 T cells in the presence of 10 μg/ml tetracycline; IFN-γ in 48-h culture supernatants was quantified by ELISA. Shown are aggregate data from two independent experiments; the two curves are not statistically different at any time point. Note the break in the scale. (B) C57epi.1 monolayers in 96-well plates, untreated or pretreated with IFN-γ (10 ng/ml for 14 h), were infected with C. muridarum (3 IFU per cell) for 24 h. At 24 h, the monolayers were washed and then cocultured with 5 × 10⁴ T cells in the presence of 10 μg/ml anti-CD4 monoclonal antibody (GK1.5) or 10 μg/ml isotype control monoclonal antibody (mouse Ig2b). Twenty-four hours later, the supernatants were collected and IFN-γ was quantified by ELISA. The percent inhibition of IFN-γ production was calculated by comparing IFN-γ production in the presence of GK1.5 to that in the presence of the isotype control antibody. The data presented are aggregate data from three independent experiments. ***, P < 0.0005; NS, not statistically significant. The error bars indicate SEM.

