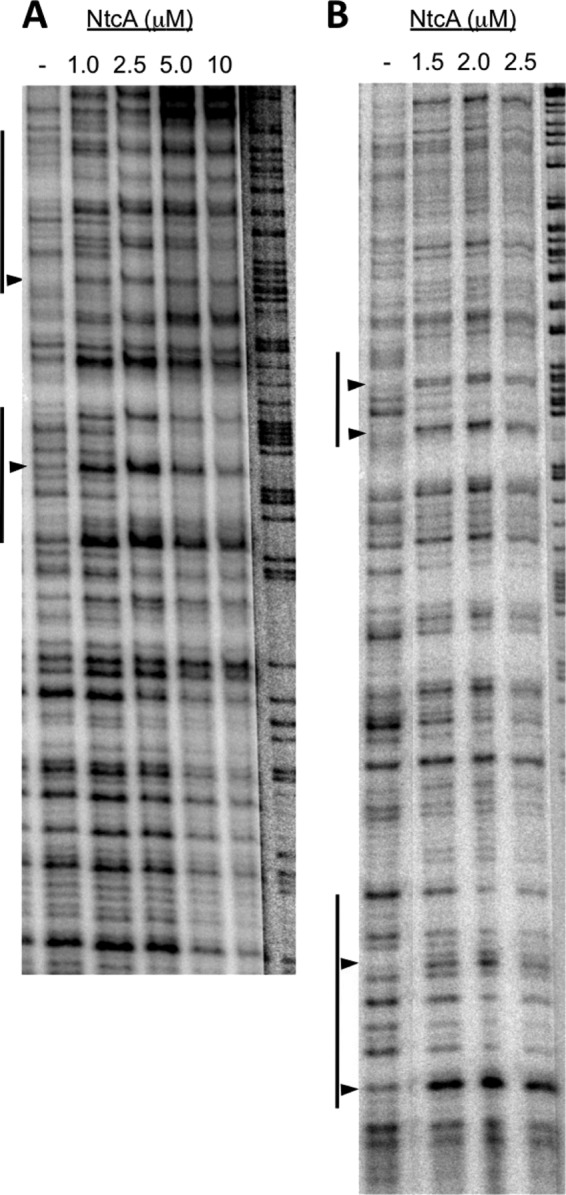
Fig 5.

DNase I footprinting of NtcA on DNA sequences between the two TSPs of the devB gene. DNase I footprinting assays were carried out with purified NtcA and DNA fragments of the devB promoter region that were amplified by PCR using primers alr3710-17 (32P labeled) and alr3710-26 (unlabeled) (upper strand, panel A) or alr3710-17 (unlabeled) and alr3710-19 (32P labeled) (lower strand, panel B) in the presence of 0.6 mM 2-OG. Except for NtcA, final concentrations of all components were the same in the different reaction mixtures. Vertical lines denote DNA stretches showing changes due to the presence of NtcA. Arrowheads point to some hypersensitive positions.
