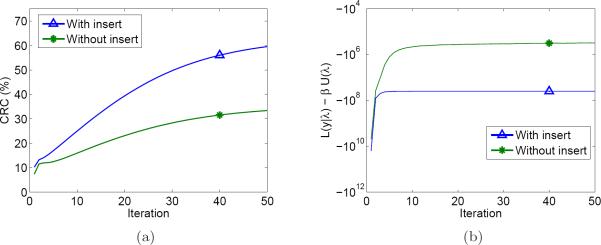
Figure 12.
Plots showing the behavior of the image reconstruction algorithm as a function of iteration. Since the Siemens reconstruction used a different algorithm and its per-iteration data was unavailable, it is not included in these plots. (a) CRC vs. iteration for the 2.5 mm radius tumor; (b) PL objective function vs. iteration.

