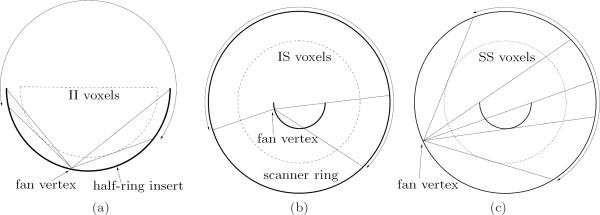
Figure 2.
In-plane diagrams of the PET system and the voxels used in the FOVs of the three coincidence types. The insert half-ring and scanner ring are represented by darker curves. An example fanbeam projection is shown for each case, with the fanbeam extent indicated by an arc with double arrows. (a) Enlarged diagram of the II FOV. The fanbeam projection shown has a large amount of missing data in the central part of the fan. (b) The IS FOV is determined by the coincidence acceptance range. The LOR shown in the middle of the fan is at the transition between LORs that pass through the insert once or not at all. (c) SS FOV and fanbeam projection. The LORs shown in the middle of the fan are at the transitions where LORs pass through the insert once, twice, or not at all.

