
Figure 1.
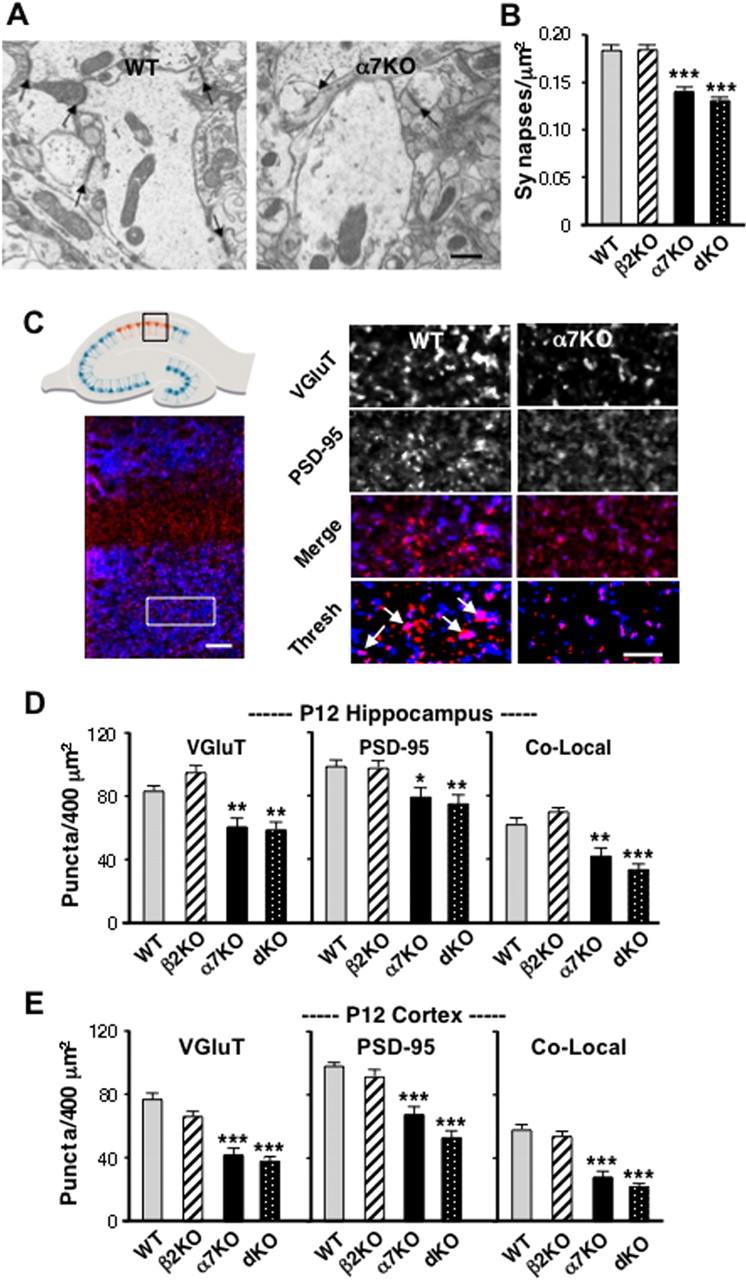
Decrement in the number of glutamatergic synapses in α7KO mice. A, EMs showing synapses (arrows) in regions containing apical dendrites of CA1 pyramidal neurons in P8 hippocampal slices from WT and α7KO mice. Scale bar, 0.5 μm. B, Number of ultrastructurally identified synapses/μm2 (≥150 images from 3 animals/genotype). C, Pictures showing a diagram of the hippocampus (upper left) with a box indicating the CA1 region used for imaging and low-magnification image of the CA1 region (lower left) with a box indicating the general area used for higher power images (right) of CA1 apical dendrite regions in P12 WT and α7KO mice. Slices were immunostained for glutamatergic synapses using the markers VGluT (blue), PSD-95 (red), and the images were merged (Merge) and thresholded (Thresh) to remove pixels of below-threshold intensity (arrows indicate examples of colocalization). Scale bars: 20 μm, left; 5 μm, right. D, Number of VGluT, PSD-95, and colocalized puncta/400 μm2 for the indicated genotype in the CA1. E, Number of VGluT, PSD-95, and colocalized puncta/400 μm2 at P12 on neurons in layer 5/6 of the cortex (3–4 cells/animal; 5–8 animals/genotype from ≥2 litters).