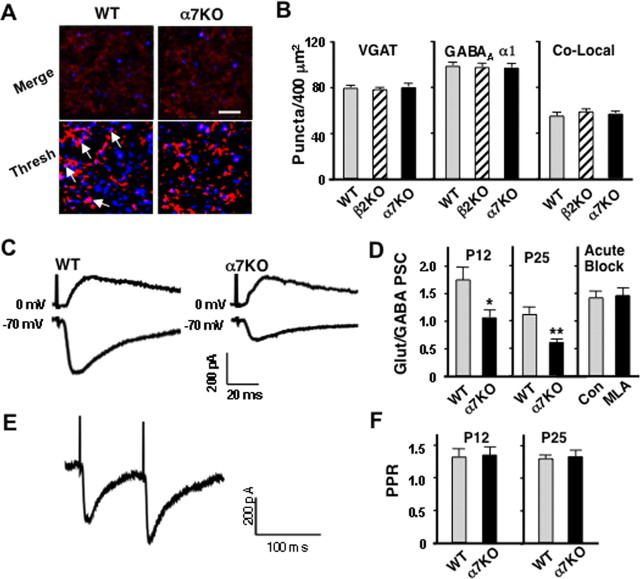
Figure 8.
Decreased ratio of glutamatergic/GABAergic input in α7KO neurons. A, CA1 apical dendrite regions in P12 WT and α7KO mice immunostained for VGAT (blue), GABAA α1 receptor (red), merged (Merge), and thresholded (Thresh). Scale bar, 5 μm. B, Number of VGAT, GABAA α1 receptor, and colocalized puncta/400 μm2 in P12 (3 fields/animal; 3 animals/genotype). C, Evoked glutamatergic PSCs recorded at −70 mV and GABAergic PSCs recorded at 0 mV (aligned by stimulus artifact) in WT and α7KO CA1 at P12. D, Ratios of evoked PSC peak amplitudes mediated by glutamatergic and GABAergic synapses for individual neurons at P12 (left) and P25 (middle; Glut/GABA PSC; 5–11 cells from 3–6 animals/genotype). Right, Ratios in WT neurons before (Con) and after adding MLA (MLA), showing that the responses are not influenced by acute endogenous α7-nAChR signaling during the recordings (5 cells from 3 animals). E, No differences were seen in PPR for evoked EPSCs amplitudes in α7KO versus WT neurons. Two EPSCs evoked in a WT CA1 pyramidal neuron clamped at −70 mV while stimulating the Schaffer collateral input twice, 100 ms apart (vertical line indicates stimulus artifact). F, Ratio of the second EPSC amplitude divided by the first (PPR) for the indicated genotype at the indicated age (5–11 cells from 3–6 animals per genotype and age).

