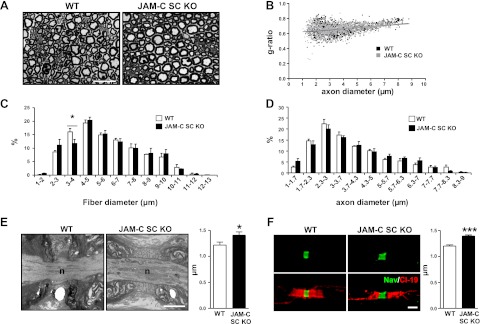
Figure 6.
Neural morphology analysis of JAM-C SC KO mice. A) Representative images of transverse semithin sections of WT and JAM-C SC KO sciatic nerve fibers. B) Scatter plot of g ratio according to axonal diameter of sciatic nerves from WT and JAM-C SC KO mice. C, D) Distribution of sciatic nerve fiber (C) and axon (D) diameters from WT and JAM-C SC KO mice. E, F) Average length of the node of Ranvier was quantified from WT and JAM-C SC KO mouse sciatic nerves by EM (E; n=19 and 30 nodes, respectively, from 3 mice/group) and by confocal microscopy (F) with teased sciatic nerve fibers immunostained for Nav channel and claudin-19 (n=113 and 109 nodes, respectively, from 3 mice/group). Scale bars = 20 μm (A); 2 μm (E, F). *P < 0.05; ***P < 0.001.

