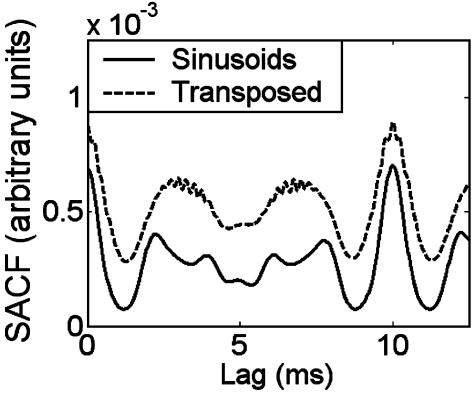
Fig. 4.
An SACF model (20) representation of harmonic complex tones consisting of either pure tones (solid curve) or transposed tones (dashed curve). Both representations in the model show a clear peak at a 10-ms lag, the inverse of the F0 of 100 Hz. In contrast, the F0 was perceived by human subjects only in the case of the pure tones.

