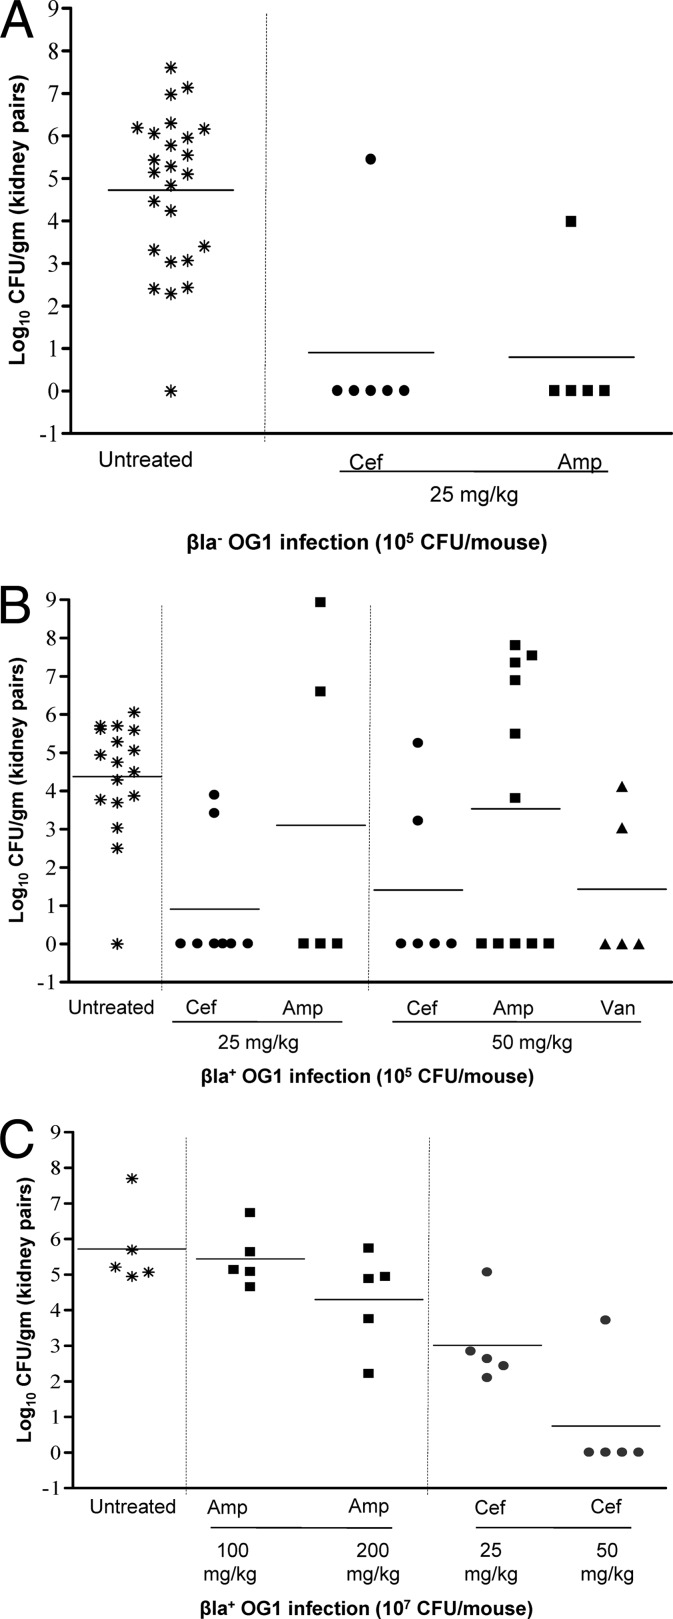
Fig 1.
Dose and inoculum effect in a mouse UTI model. (A) Bla− OG1 at an inoculum of 105 CFU. Bacterial counts from kidneys of mice treated with ceftobiprole (single 25-mg/kg dose) and ampicillin (two 25-mg/kg doses) and untreated controls are shown. Horizontal bars represent the geometric means (P < 0.001 for ceftobiprole and ampicillin at 25 mg/kg for all treated versus untreated control mice). (B) Bla+ OG1 at an inoculum of 105 CFU. Bacterial counts from kidneys of mice treated with ceftobiprole (single doses of 25 and 50 mg/kg), ampicillin (two doses of 25 and 50 mg/kg each), and vancomycin (single dose of 50 mg/kg) and untreated controls are shown. Horizontal bars represent the geometric means (P < 0.0001 and < 0.002 for ceftobiprole at 25 and 50 mg/kg, respectively, P > 0.3 for ampicillin at 25 and 50 mg/kg, and P < 0.002 for vancomycin at 50 mg/kg for all treated versus untreated control mice). (C) Bla+ OG1 at an inoculum of 107 CFU. Bacterial counts from kidneys of mice treated with ceftobiprole (single doses of 25 mg and 50 mg/kg) and ampicillin (two doses of 100 and 200 mg/kg each) and untreated controls are shown. Horizontal bars represent the geometric means (P < 0.005 for ceftobiprole at 25 mg/kg versus ampicillin at 100 mg/kg and P < 0.005 and 0.006 for ceftobiprole at 50 mg/kg versus ampicillin at 100 mg/kg and 200 mg/kg, respectively).

