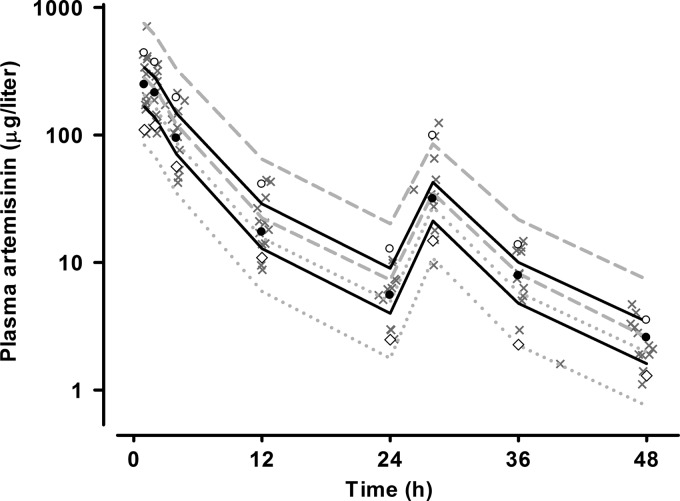
Fig 4.
Visual predictive check showing observed 50th (●), 10th (♢), and 90th (○) percentiles with simulated 95% CIs for the 50th (solid black line), 10th (gray dotted lines), and 90th (dashed gray lines) percentiles for plasma artemisinin concentrations (micrograms per liter on a log10 scale) versus time (h) from the final model. The observed data are superimposed as gray crosses.

