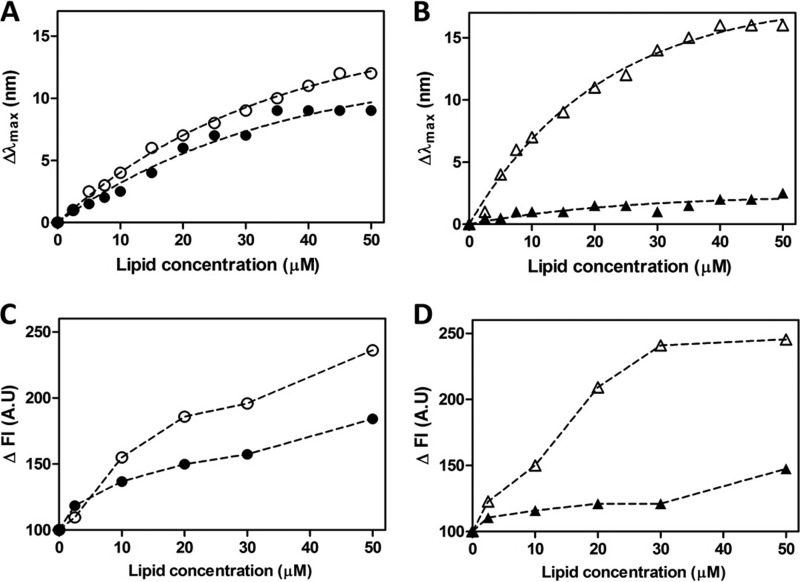
Fig 6.
Fluorescence spectroscopy investigation of AMP lipid membrane interactions. Tryptophan fluorescence blue shifts (Δλmax) (A and B) and increases in fluorescence emission intensity (ΔFI) (C and D) were recorded in the presence of SUVs. Data for 2 μM CaLL (A and C) and 2 μM PEG2-CaLL (B and D) were recorded upon titration of increasing concentrations of 100-nm-diameter SUVs comprising either POPG (empty symbols) or POPC (filled symbols).

