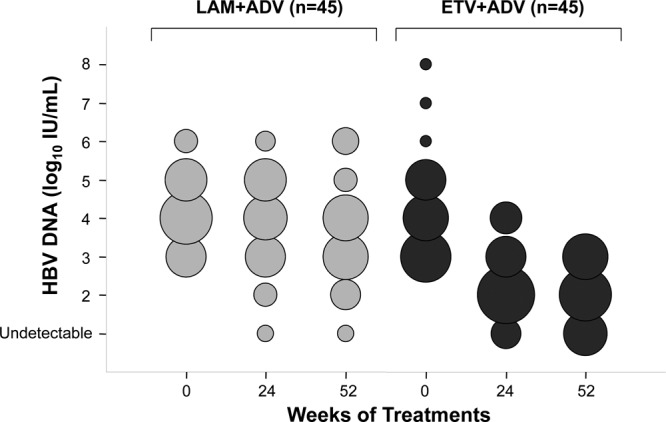
Fig 2.

Distribution of patients according to serum HBV DNA concentrations through week 52 by study visit and treatment group. The diameters of the circles are proportional to the numbers of patients with specified HBV DNA concentrations; the numbers represented by the circles in each column total 45. The log HBV DNA concentrations indicated on the y axis reflect all observations within that exponent.
