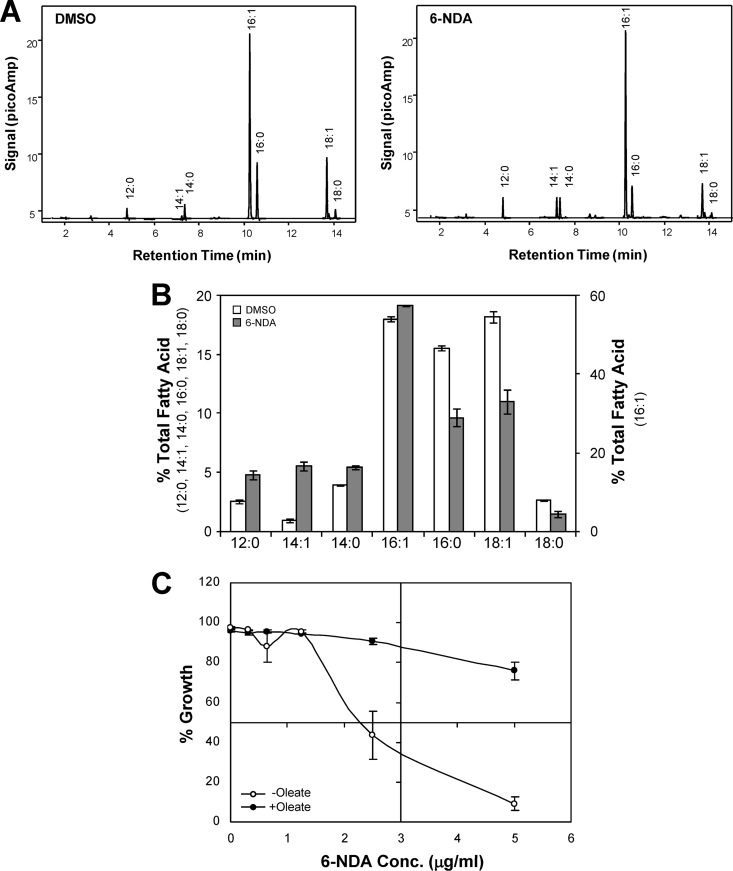
Fig 4.
Effect of 6-NDA on fatty acid homeostasis in S. cerevisiae. (A) Cells of S. cerevisiae strain S288C were grown under experimental conditions identical to those used for microarray analysis. Cells were treated with either DMSO (0.25%) or 6-NDA (2.2 μg/ml) for ∼15 h, and their fatty acid profile was determined by GC-FAME analysis. Three independent experiments were performed on independently grown cultures. Gas chromatograms from one representative experiment are shown. (B) Percent total fatty acid values shown are the means from the three experiments ± standard deviations. The chain length and level of desaturation of the fatty acids detected are shown on the x axis. The differences in fatty acid levels between DMSO-treated and 6-NDA-treated samples were statistically significant (P value of <0.05) based on an independent two-tailed t test, with equal variance. (C) Broth microdilution assays were performed in triplicate using S. cerevisiae strain S288C grown in the presence of various concentrations of 6-NDA, with 1.56 μg/ml oleate (+oleate) or without oleate (−oleate). Percent growth is shown as the mean ± standard error of the mean.

